


Aydınlatma metni yükleniyor…
Digital agency performance should be measured through a KPI chain that runs from business outcomes to data quality, not through one headline metric. A useful report explains what happened, the conditions behind the result, the limits of the data, the decision to take, its owner and its due date.
This prevents dashboards full of numbers from replacing judgement. The aim is neither to hold an agency responsible for every commercial outcome nor to hide weak outcomes behind traffic metrics. It is to separate agency influence from other business variables and choose the next appropriate action.
Why Agency Performance Cannot Be Measured with One Metric
Revenue, qualified opportunities and renewals are strong business outcomes, but they do not explain the cause of a change on their own. Channel metrics such as click-through rate, cost and visibility help diagnose delivery, yet do not prove business value by themselves. Confusing these levels either assigns sales problems outside the agency's control to the agency or uses impressive traffic figures to obscure the commercial result.
A measurement system needs both outcomes and causal indicators. The outcome shows direction, intermediate behaviours show progress, channel indicators reveal optimisation options, and data quality shows how much confidence the interpretation deserves.
Business Outcomes, User Behaviour and Channel Indicators
| Level | Question | Example |
|---|---|---|
| Business outcome | Was verifiable value created? | Confirmed sale, qualified opportunity, renewal |
| Value event | Did the user complete a critical step? | Eligible form, booking, proposal request |
| Leading behaviour | Is there a signal of intent or progress? | Pricing visit, product comparison, return visit |
| Channel diagnostic | Where are distribution and messaging working? | Impression share, click rate, reach, query quality |
| Data quality | How much can we trust the number? | Tag coverage, duplicates, consent loss, CRM match |
The Five-Level KPI Ladder
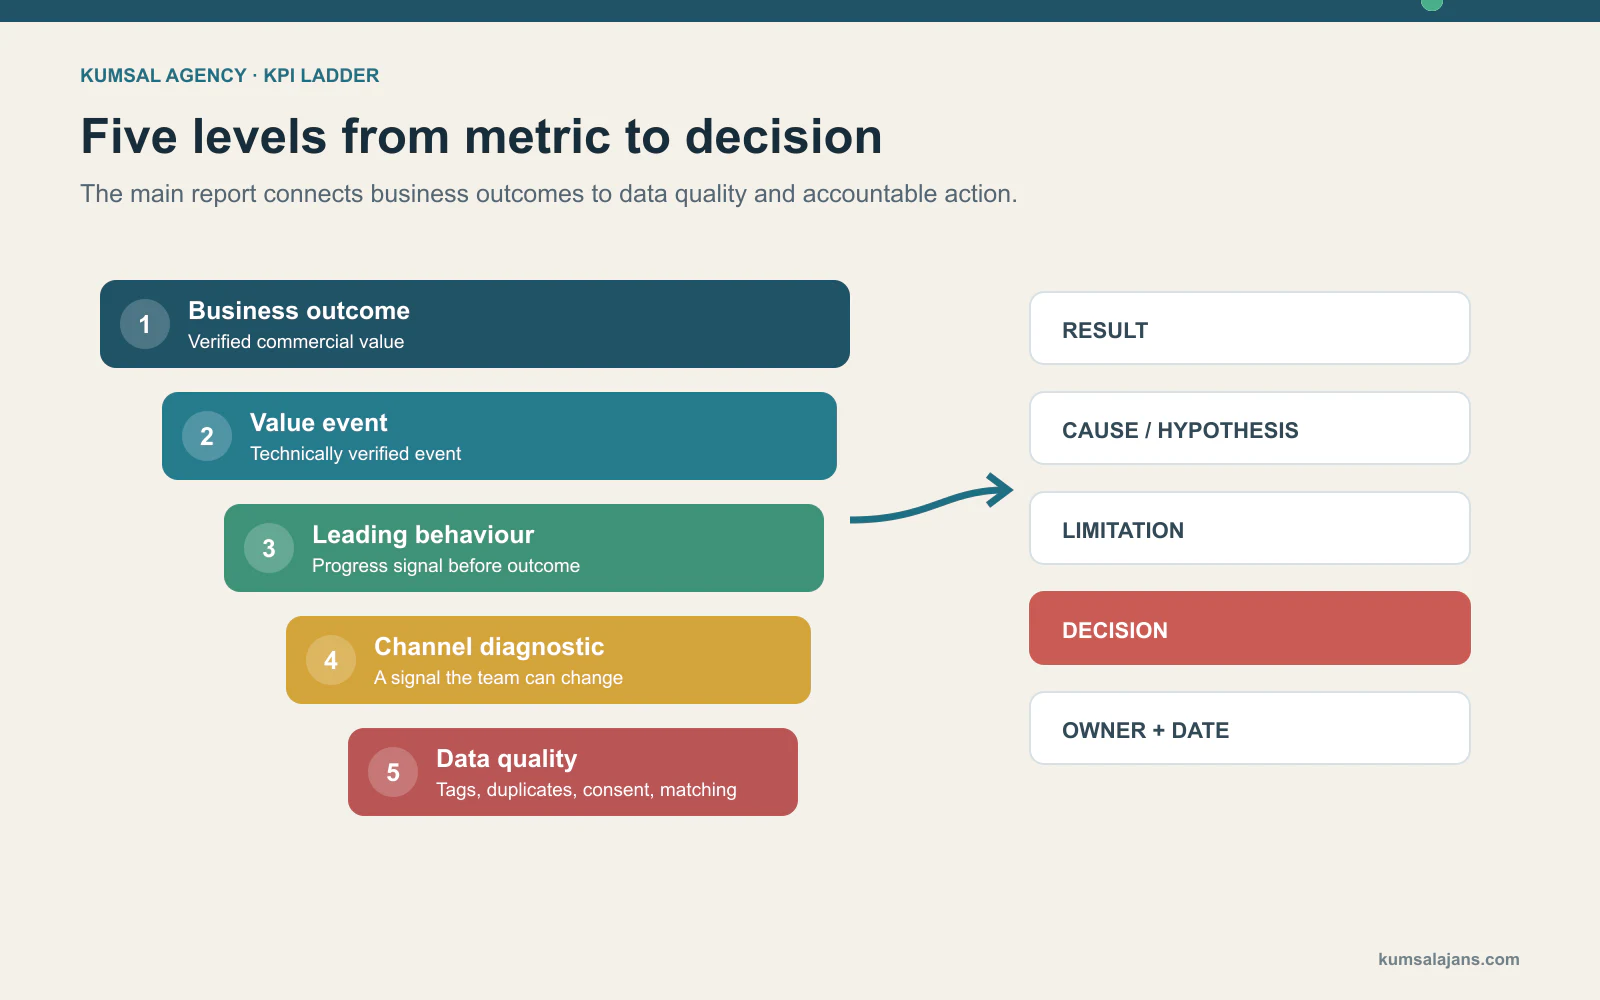
Build the measurement logic from the top down instead of collecting convenient metrics from the bottom up:
- Business outcome: Which verifiable business value should the work support?
- Verified value event: How is the digital action connected to the real customer or sales process?
- Leading behaviour: Which action shows meaningful progress before the final outcome?
- Channel diagnostic: Which targeting, creative, content, bid or landing-page signal can the agency change?
- Data quality: Which tagging, consent, matching or reporting issue limits the interpretation?
You do not need dozens of KPIs at each level. Choose a small set for primary decisions and keep secondary metrics for diagnosis. If a metric would never change a decision, it may not belong in the main report.
Define Value Events Precisely
Google Analytics describes a key event as an event that measures an action particularly important to a business. (Google Analytics key events guidance) A button click, however, may not prove that a form was delivered or that the enquiry was qualified.
For every value event, document its name, trigger, repeat-counting rule, test method and verification field in the business system. Measure a proposal form through successful submission rather than a click; where possible, separate spam, duplicate and ineligible records through CRM status. If offline stages cannot be measured, state that limitation in the report.
Select Channel Diagnostics That Lead to Action
Organic sessions alone for SEO, clicks or cost per click alone for paid media, and follower count alone for social media all lack context. A diagnostic metric should connect to a lever the team can change.
- SEO: target-query and page visibility, correct landing page, crawl/index status and outcome behaviour;
- Paid media: suitable audience reach, query or placement quality, creative response, landing experience and cost per verified value;
- Content: intended search or distribution visibility, progression to relevant pages, return behaviour and contribution to a value event;
- Social: target-audience reach, content response, qualified site visits and behaviour aligned with the campaign objective.
The same metric does not carry the same meaning in every campaign. Impressions may be necessary in an awareness programme, but they are not sufficient evidence of success in a sales programme.
Data Quality: Tags, Duplicates, Consent, Matching and Sampling
Before reviewing performance, ask whether the data is dependable. Does the tag work across the required pages? Is an event sent twice? Does consent limit observation? Are domains connected correctly? Do platforms use the same time zone and currency? Are bots and internal traffic handled appropriately?
Google Analytics can show indicators relating to conditions such as data sampling or thresholding. (Google Analytics data-quality indicators) When these indicators appear, explain the constraint instead of presenting precise percentages without qualification. If platform and CRM totals disagree, inspect identity, date, status and duplicate rules rather than declaring one source automatically correct.
How Attribution and Date Ranges Change the Report
An attribution model determines how credit is distributed across touchpoints; different models may show channel contribution differently. Google Analytics provides a model comparison report for this purpose. (Google Analytics attribution model comparison)
Keep the attribution model, lookback window, channel grouping, time zone and filters consistent across period comparisons. If settings change, do not present the series as directly comparable without disclosure. A seven-day revenue view is also a poor comparison with a mature period when the sales cycle lasts 60 days.
Set a Target, Baseline and Decision Threshold
For each KPI, record the starting level, comparison period, acceptable variation and decision threshold as well as the target. In seasonal businesses, the comparable period from the previous year and the campaign conditions may be more informative than the previous month alone.
A threshold should be more useful than “below target”. For example, if volume is sufficient and cost per verified enquiry remains outside the accepted range for two reporting periods, the team may open a targeting and landing-page test. Set thresholds from unit economics and data volume; do not present them as universal ratios.
Give Weekly, Monthly and Periodic Reports Different Jobs
| Rhythm | Main job | Content |
|---|---|---|
| Weekly check | Exceptions and operations | Budget variance, measurement failure, critical delivery change, open action |
| Monthly report | Decision and learning | KPI chain, explanation, test result and next decision |
| Periodic review | Strategy and resources | Goal fit, channel role, budget allocation, scope and capacity |
Treating daily or weekly noise as a strategic conclusion can cause unnecessary intervention. Conversely, the team should not wait for a monthly meeting when tracking fails or spend moves out of control.
A Decision-Ready Reporting Template
| Field | What to record |
|---|---|
| Result | Which KPI changed, in which period and against which reference? |
| Cause / hypothesis | What evidence supports the explanation, and what remains untested? |
| Limitation | How do data, attribution, volume or external conditions limit the conclusion? |
| Decision | What will we continue, stop, change or test? |
| Owner | Who in the agency, client or third party will deliver it? |
| Date and acceptance | When is it due, and how will completion be verified? |
“Traffic increased by X%” is not a complete reporting statement. Add the source of the increase, whether it progressed to a value event, the measurement limitation and the next decision. Show absolute volume beside percentage change because a small base can produce a large rate.
Questions for the Reporting Meeting
- How did the business outcome and verified value event change?
- Is the proposed cause evidence, a strong signal or only a hypothesis?
- Which data-quality issue limits interpretation?
- Which factor can the agency change, and which dependency belongs to the client?
- Was the previous action completed, and what did we learn?
- What will we stop, continue or test now?
- Who owns the decision, when is it due and what is its acceptance condition?
Separate Agency Control from Client Responsibility
An agency may work on targeting, bids, creative, content, technical recommendations or reporting. The client may control price, stock, product fit, sales response time, call quality, fulfilment and customer experience. Implementation access, content approval and development may be shared with a third-party supplier.
For each KPI, distinguish the roles that own the outcome, influence it and verify the data. This turns weak results into a bottleneck discussion rather than blame, and avoids assigning a strong result to a single channel without evidence. Review the digital marketing agency services guide for possible scopes and responsibilities, and the digital agency selection guide for partnership criteria.
Fictional Example: From KPI Tree to Decision
The following non-numeric scenario is fictional and is not a client result. Imagine that a B2B service company has flat qualified-opportunity volume while advertising clicks increase. A five-level review finds that form submissions rose, but the share of CRM opportunities matching the required sector and company size fell, while some records were counted twice.
More clicks are not a successful outcome in this situation. The decision could be to narrow targeting and messaging around qualification, test a necessary screening field, repair the CRM duplicate rule and monitor cost per verified opportunity next period. The agency owns campaign and form tests, the client owns the sales definition and CRM status, and the technical team owns duplicate control.
Conclusion: The Report Should Produce a Decision
A sound performance system connects business outcomes to channel metrics without confusing them. It defines value events technically, makes data quality visible, keeps comparison settings consistent and ends each meeting with a decision, owner and due date.
To structure channel, measurement and reporting scope together, contact Kumsal Agency.
Related guides: For the next decision steps, review the digital agency contract and responsibility checklist and the digital agency pricing and proposal comparison guide.