Aydınlatma metni yükleniyor…
Improving manufacturing efficiency requires more than tracking total output. A plant must understand how long each machine was available for production, how closely it operated to its target cycle rate and how much of its output met quality requirements. Overall Equipment Effectiveness (OEE) combines these three dimensions into a shared metric. Yet a trustworthy OEE figure depends on much more than the percentage displayed on a screen. It requires a reliable data model, explicit calculation rules and downtime records that can be traced back to their source.
An OEE and downtime tracking web dashboard should therefore not be treated as an off-the-shelf reporting screen filled with standard charts. It should be a custom management system designed around the plant’s production structure, shift patterns, data sources, quality processes and use of ERP or MES platforms. Its purpose is to turn raw machine signals and user-entered records into shared, actionable information for production managers, maintenance teams, quality specialists, process improvement leads and IT teams.
What is OEE, and what does it measure?
OEE is calculated by multiplying availability, performance and quality: OEE=Availability × Performance × Quality. IBM’s explanation of OEE similarly describes a metric that considers production time, operating speed and good output together. Because a loss in any one component reduces the final result, an effective dashboard must present each component separately, together with the records behind it, rather than showing only a headline OEE percentage.
Availability
Availability compares actual operating time with planned production time. Operating time is generally calculated by subtracting failures, setup periods, material shortages and other qualifying stops from planned production time. However, whether breaks, public holidays or scheduled maintenance belong in the denominator is a plant-specific policy decision. The system should not hide that decision inside application code. It should store calculation policies as versioned rules that authorised users can manage and audit.
Performance
Performance shows how closely equipment approaches its ideal cycle rate while running. A common formula multiplies ideal cycle time by total output and divides the result by actual operating time. Using one generic machine speed can be misleading when the ideal cycle changes by product, recipe, mould or line. The valid standard should therefore be stored with its product and effective-date context. This prevents a later standards update from silently changing historical reports.
Quality
Quality is the proportion of good units within total production. The treatment of scrap, rejected output, rework and conditionally accepted products must be defined explicitly. If final quality results arrive later from a laboratory, MES or ERP platform, the dashboard should distinguish preliminary values from approved results. Retrospective changes should record the user, timestamp and reason so that revised OEE figures remain explainable.
Begin with an analysis of manufacturing data sources
The project should first establish where each data item originates and which system owns the authoritative record. A PLC, SCADA platform or IoT gateway may provide running and stopped signals. MES may hold work orders, operations and production quantities. ERP may be the master source for products, routings, shift calendars, orders or quality results. A maintenance management system may contain failure notifications, maintenance work orders and intervention times. Manual forms and spreadsheets may also remain important parts of the current workflow and should not be ignored during discovery.
For every source, document identifiers, update frequency, timestamps, time zone, connection method, acceptable latency and failure scenarios. ISA-95 provides a useful reference for defining boundaries and information exchange between manufacturing operations and enterprise systems. The ISA-95 standard is particularly relevant when modelling integration between level 3 systems such as MES and level 4 applications such as ERP.
This discovery stage should also expose differences in meaning. A “completed quantity” in one system may include output awaiting inspection, while another may count only accepted units. A shift may be identified by a code in ERP but calculated from local timestamps in the machine layer. These differences must be resolved before dashboards are trusted for operational decisions.
Build a shared manufacturing data model
The dashboard’s foundation is a manufacturing data model that brings codes from multiple systems into one operational context. Relationships should cover plant, department, line, work centre, machine, shift, team, product, work order, operation and batch. If a machine’s PLC tag differs from its ERP work-centre code, the architecture should use a persistent mapping table. Temporary transformations applied only in the interface are likely to break when a source system or coding convention changes.
A core event record should include start and end times, equipment, event state, source system, work order, product, shift and data-quality status. Production counters may reset, messages may arrive twice and network connections may fail. Raw events should therefore be retained so derived durations and OEE results can be recalculated. A KPI is not fully auditable if users cannot inspect its source, transformation rule and calculation version.
The model also needs clear identity rules. Events may require a source-generated identifier or a deterministic key that makes repeated delivery safe. Effective dates should be attached to mappings and standards, while late-arriving records should be incorporated without overwriting the original history. This structure supports both current monitoring and credible long-term comparisons.
Design the downtime reason tree and record lifecycle
The value of downtime tracking comes not from knowing that a machine stopped, but from explaining the stop consistently. A reason tree can begin with planned and unplanned downtime, then divide events into equipment failure, changeover, cleaning, quality inspection, material shortage, staff shortage or upstream and downstream waiting. Sub-reasons should be manageable by plant and equipment group. Free text should supplement structured classification, not replace it.
When a signal arrives, the system can open a downtime event automatically. An operator then selects an appropriate reason within a defined period and, where necessary, adds a note or photograph. A long or critical stop can be escalated to maintenance, and the shift supervisor can verify its classification. Later edits should preserve the previous value, new value, user and timestamp in an audit trail. The dashboard then becomes a workflow for improving record quality rather than a passive reporting layer.
The operator interface should require only a few taps and show the active machine, the current stop and contextually relevant reasons. Large touch targets, short lists and an offline queue matter on tablets, terminals and mobile devices. Safe synchronisation, idempotent retries and visible submission status can follow principles similar to those used when planning a warehouse mobile app with offline workflows.
Define what “real time” means for each source
Real-time visibility does not mean the same latency for every record. Machine state may update within seconds, while ERP work orders or approved quality results may arrive every few minutes. The architecture should support event-driven transfer, scheduled integration and user input together. Each dashboard card should display its last update time and data status so delayed information is never presented as current.
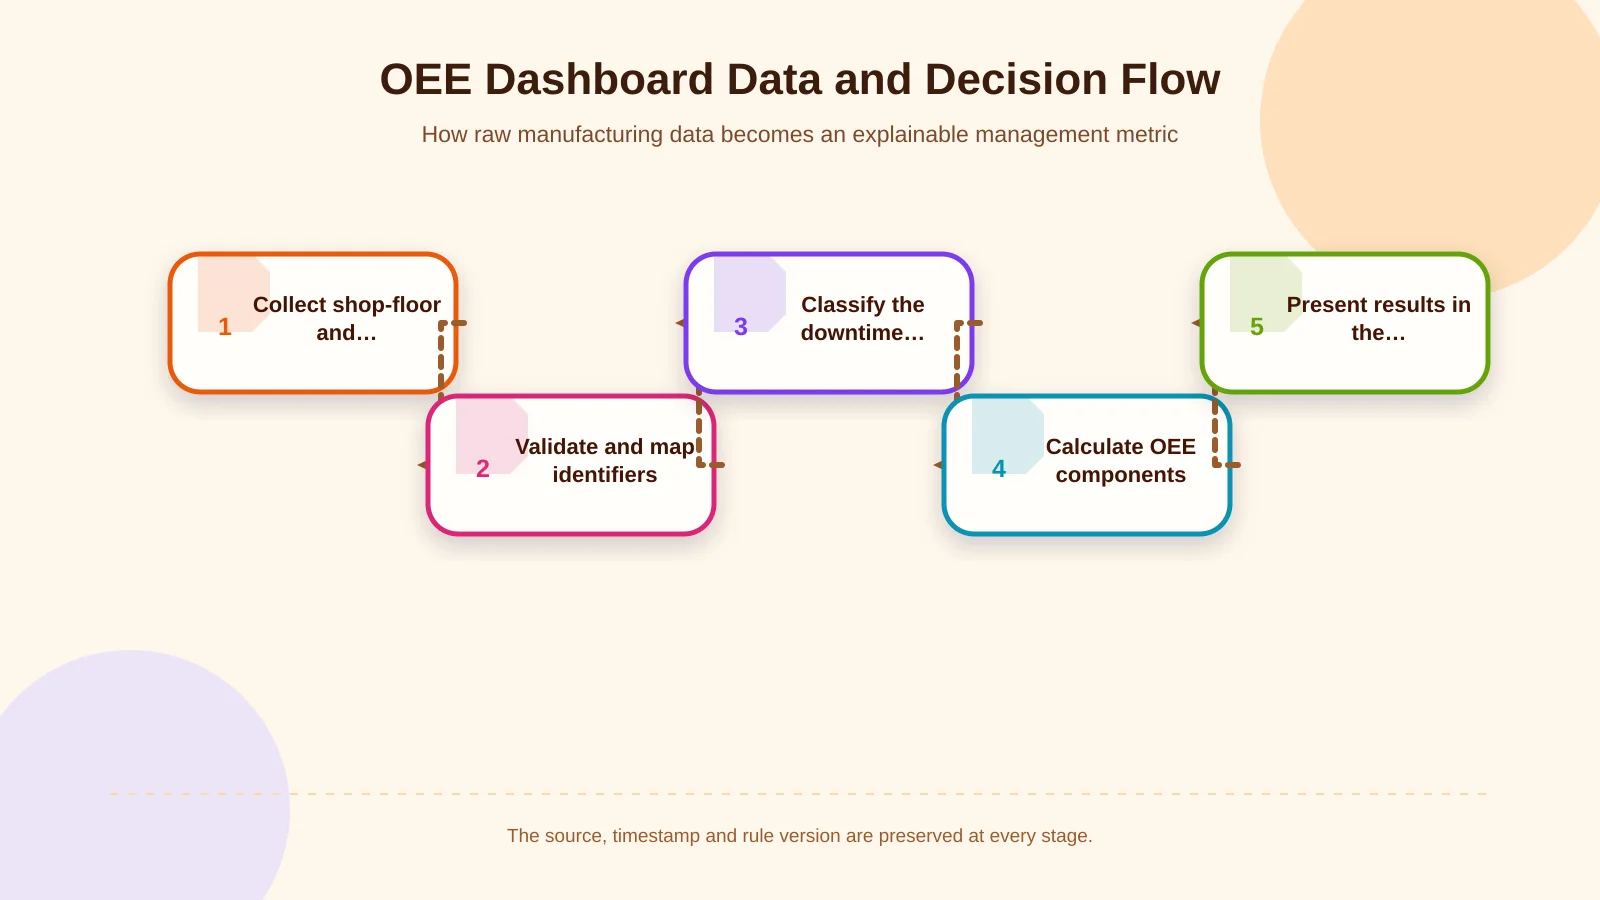
A typical flow moves from shop-floor data capture through validation and mapping, storage in the shared event model, OEE calculation and finally the web interface. A message queue or comparable buffer can reduce data loss during temporary interruptions. Duplicate messages should be identified through unique event IDs, while missing time ranges should enter a data-quality queue. When connectivity returns, records can be reconciled safely rather than being inserted blindly.
Monitoring should cover more than whether an integration endpoint is online. Teams need visibility into delayed messages, unmatched equipment codes, counter anomalies, overlapping events and records awaiting classification. These indicators help IT and operational users distinguish a genuine production loss from a data-collection problem.
| Component | Core data | Loss made visible | Control point |
|---|---|---|---|
| Availability | Planned time and downtime | Failures and waiting | Planned versus unplanned classification |
| Performance | Cycle time, quantity and operating time | Speed losses and minor stops | Product-specific ideal cycle time |
| Quality | Total and good quantities | Scrap and rework | Quality-result status |
| OEE | All three components | Overall effectiveness loss | Rule and data version |
What should management dashboards display?
The main view should present the plant’s current condition in a hierarchy suited to rapid decisions. OEE and its three components can sit at the top, followed by line and machine breakdowns, active downtime, target-versus-actual production and data-quality warnings. Colour must not carry meaning alone; it should be supported by a status label, duration and threshold.
- Filters for plant, line, machine, shift, product and date
- OEE, availability, performance and quality trends
- Active downtime and events awaiting intervention
- Pareto analysis of reasons by total duration or frequency
- Planned versus unplanned downtime comparisons
- Target and actual quantities, scrap and rework
- Warnings for missing classifications, delayed sources and mapping errors
- Drill-down views for raw records and calculation details
Selecting a KPI card should reveal the shifts, events, counters and calculation policy that produced it. This drill-down replaces recurring debates about why figures differ with evidence-based investigation. Comparisons can also show lost minutes and estimated production impact alongside percentages, helping managers prioritise losses that matter operationally.
Different roles may require different default views. A production manager may focus on line performance and output risk, while maintenance needs active failures, intervention history and recurring technical reasons. Quality teams need approval status, scrap and rework detail. These views can use the same governed model without forcing every user to navigate the same interface.
Roles, permissions and auditability
Operators may select downtime reasons; maintenance teams may add technical causes and work-order references; quality teams may approve accepted and rejected quantities; and managers may monitor targets. System administrators manage mappings and calculation policies. Access should be restricted by plant, line and action, with separate permissions for viewing, editing, approval and export.
When an ideal cycle time, downtime category or formula changes, its effective date must be recorded. Whether previous periods will be recalculated under the new rule should be a controlled decision. Personal accounts, strong authentication, session logging, encryption in transit, backups and retention policies should be planned from the beginning. These controls support customer confidentiality and the integrity of commercially sensitive production data.
Critical ERP and MES integration decisions
Ownership must be defined for products, routings, work centres and work orders received from ERP. If production confirmations are sent back, the system should track acceptance, rejection and retry responses. Field mapping, duplicate prevention and exception queues resemble the integration controls described in website–CRM integration planning, even though manufacturing requires its own transaction rules and operational context.
Integration is not merely a technical connection. Stakeholders must decide which platform is authoritative for product names, shift calendars, good quantities and work-order status. ISA-95 offers a shared language for discussing information exchange between levels 3 and 4. A NIST report addressing OEE also notes that definitions and calculation interpretations can differ, reinforcing the need for a documented calculation policy.
Phase the project around a representative pilot
A practical starting point is one critical line or a pilot area representative of the wider plant. The team first reviews data sources and current recording practices, then creates the KPI dictionary, reason tree, user roles and interface prototypes. During the pilot, automatic signals should be compared with actual shop-floor events. Expansion to other lines should begin only after data quality reaches an agreed acceptance level.
Success should not be measured solely by whether the dashboard has launched. Useful indicators include the percentage of downtime events classified, the number of missing events, integration latency, records requiring manual correction and loss reasons that lead to action. The system should accommodate new machines, products and shift models. Separating the calculation engine from the interface also makes maintenance and future development more sustainable.
A custom OEE dashboard with Kumsal Agency
Kumsal Agency is an Istanbul-based digital agency that designs and develops custom web software around business processes, user roles, data structures and integration requirements. Its approach to OEE and downtime tracking is not based on presenting a generic ready-made product. It focuses on adapting robust software infrastructure, a shared data and management system, security and a user-centred interface to the plant’s actual operating model.
With its Enterprise Resource Planning expertise, Kumsal Agency can approach the manufacturing dashboard as a management layer connected to ERP, MES, maintenance and quality processes—not simply as a standalone screen displaying machine signals. To analyse your plant’s data sources, OEE calculation policies, downtime recording workflow and ERP integration needs, and to define the scope of a custom web dashboard, contact Kumsal Agency.