


Aydınlatma metni yükleniyor…
AI search visibility cannot be measured reliably with one “GEO score.” A useful measurement system separates five layers: technical eligibility, observed visibility across a controlled query sample, official platform data, visits and on-site behaviour, and business outcomes.
Without those distinctions, teams may report a brand mention as traffic, treat a citation as a sale, or present one prompt screenshot as evidence of market-wide visibility.
Every GEO metric should answer four questions:
- What exactly is being measured?
- Which platform, query sample and period produced the data?
- Which baseline is used for comparison?
- What does the metric not prove?
Define the measurement terms first
Similar terms in AI search reports may describe different events.
| Term | Definition | What it does not prove on its own |
|---|---|---|
| Eligibility | The page is technically accessible and can be considered by the relevant system | Visibility or citation |
| Brand mention | The brand name appears in answer text | Correct context, source link or visit |
| Service association | The brand is associated with a particular service or problem | A visit or conversion |
| Citation/source | A URL is shown as a visible source in an answer | Click, authority, ranking or sale |
| Impression | A link or content was displayed according to the platform’s definition | Click or reading |
| Click | A user clicked the reported link | Qualified engagement or conversion |
| Session | An analytics system recorded a website visit | The visitor’s full decision journey |
| Conversion | A predefined important action occurred | Revenue, quality or causation by itself |
Agree on this glossary across the client, agency and analytics teams before reporting begins. Never write “visibility increased” without naming the event that increased.
The Kumsal Ajans Five-Layer GEO Measurement Chain
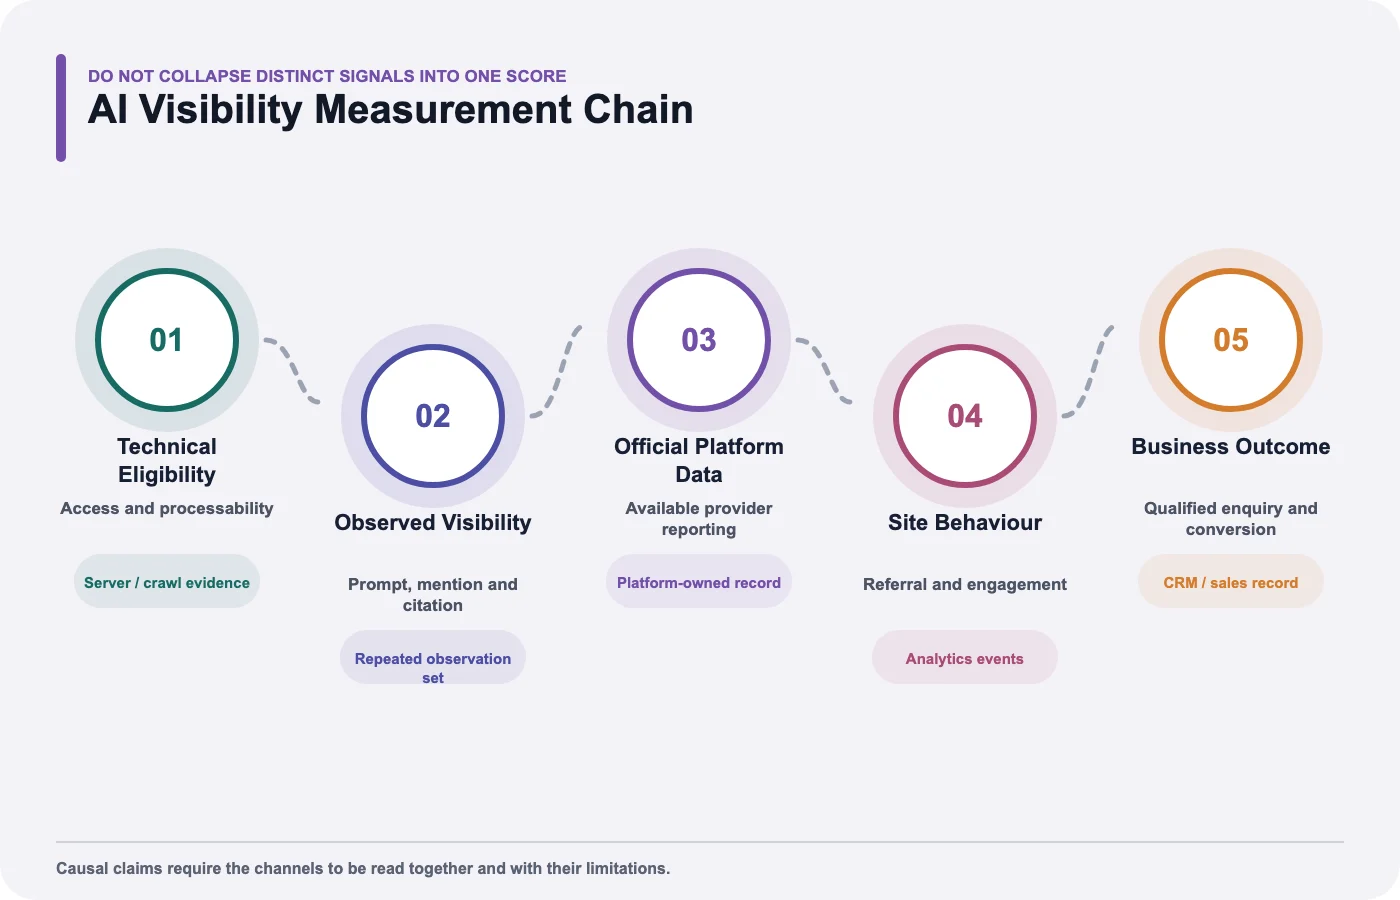
Kumsal Ajans’ confirmed reporting scope can include organic traffic, rankings, impressions and clicks, conversions, technical SEO status and GEO visibility. Access to Search Console, Analytics and relevant reporting interfaces can be provided according to project scope.
The chain below keeps those signals separate rather than compressing them into an opaque score.
Layer 1: Technical eligibility
The first layer is a prerequisite, not a performance result. If a priority page cannot be accessed or a target crawler is blocked accidentally, interpreting an absence of visibility as content failure would be misleading.
Track items such as:
- HTTP status for priority URLs
- Indexing and snippet eligibility
- Crawler access through
robots.txt, CDN and WAF layers - Canonical and redirect consistency
- Availability of the main textual content
- Technical change and retest dates
You may report the share of critical URLs that passed a defined check, but that percentage is not a ranking or citation rate. A single blocker on the primary commercial page may matter more than a high site-wide pass rate.
For the shared technical foundation, see our guide to effective SEO techniques.
Layer 2: Observed visibility in a controlled query sample
Not every platform gives site owners a complete visibility report. A dated, predefined query or prompt sample can provide a limited observational view.
Build query groups around the business objective
Use the relevant groups:
- Brand: What services does the company provide?
- Service/category: How should a B2B company conduct a GEO audit?
- Problem: Why is a website absent from AI-powered search?
- Comparison: What is the difference between SEO and GEO?
- Decision: Which reports should a buyer request from an SEO/GEO agency?
Real queries must reflect the company’s audience, services and market. Adding hundreds of arbitrary prompts does not automatically make the sample representative.
Record the test conditions
For every observation, record:
- Platform and answer surface
- Exact query or prompt
- Language and country
- Date and time
- Signed-in or signed-out state where observable
- Whether the brand was mentioned
- Whether the correct service was associated
- Whether an owned URL was cited
- Whether material information was wrong or outdated
- Which competitors and source types appeared
Models, indexes and web results change. The same query may produce a different answer later, so one test should not be treated as a permanent present/absent verdict.
Calculate only sample-specific metrics
- Brand mention rate: tests containing the brand / tests with a valid response
- Correct association rate: correct service associations / tests mentioning the brand
- Owned-source rate: tests citing an owned URL / tests with a valid response
- Material-error rate: tests containing wrong or outdated information / tests mentioning the brand
- Competitor visibility rate: tests mentioning a named competitor / tests in the relevant query group
Always show the denominator, platform and period. “40% visibility” is not meaningful unless readers know whether it represents two of five tests or two hundred of five hundred.
Layer 3: Official platform performance and citation data
A controlled prompt sample is observational. When a platform provides an official site-owner report, analyse it separately.
Google Search Console generative AI reporting
Google announced dedicated Search and Discover generative AI performance views in June 2026. According to the official launch announcement, the reports show impressions for URLs appearing in generative AI features, along with pages, countries, devices where available, and date-based trends.
Google also said the reports were initially rolling out to a subset of websites. Do not assume every Search Console property has access.
Google’s current generative AI optimization guide recommends using the dedicated report where available and warns that third-party tools do not have access to Google’s internal ranking or AI-system metrics.
Search Console’s general Performance reporting documentation defines metrics such as impressions, clicks and CTR within Google’s reporting scope. These figures must not be treated as visibility data for other AI platforms.
Record:
- Whether the dedicated generative AI view is available
- Its reported impressions, pages, countries, devices and dates
- General Web performance impressions, clicks and CTR where relevant
- Applied filters and comparison periods
- Data suppression, anonymisation or availability limitations
This is Google-specific data. It does not represent visibility on ChatGPT, Perplexity, Copilot or every other AI system.
Bing AI Performance
The Bing AI Performance report can provide aggregated citation information for supported Microsoft AI experiences, including measures such as total citations, cited pages, trends and grounding-query information.
Microsoft’s stated boundaries are essential:
- Citation data is not a ranking, authority or importance score.
- Grounding queries are not a complete record of individual user prompts.
- Data may be aggregated or sampled.
- A citation change cannot automatically be attributed to one content edit or model change.
- A citation does not mean a click, visit or interaction occurred.
Use this report to explore which pages and topic groups appear as sources—not to claim which activity generated sales.
Layer 4: Website visits and behaviour
A visible source link may generate a visit, but referral information is not always passed or classified consistently. Analytics sessions therefore do not need to match platform citation totals.
Google Analytics traffic-source documentation defines source as the platform, website or location that referred the user and medium as the traffic category, such as organic, referral, paid or email.
Possible measures include:
- Referral sources associated with AI platforms
- Organic and referral sessions
- Landing pages
- Engaged sessions and engagement rate
- Form starts and completions
- Phone, messaging or email clicks
- Movement from an article to a service page
- New and returning user behaviour
State two limitations clearly:
- Referrer data may be absent, causing some visits to appear as direct or another channel.
- The recorded source or last interaction does not explain every earlier brand touchpoint.
Do not label counted AI-referral sessions as the complete impact of AI search.
Layer 5: Business outcome and qualified demand
The final layer explains why visibility is being measured. The relevant conversion depends on the business:
- Contact or proposal form
- Qualified demo request
- Appointment
- Phone conversation
- Guide or document download
- Subscription
- Sales opportunity
- Revenue, only when supported by CRM or financial records
Define the conversion, not merely its label. Does “lead” mean any submitted form, valid contact information or an opportunity accepted by sales? A change to that definition can invalidate period comparisons.
Add a quality layer
High traffic can produce little business value. Classify enquiries where appropriate:
- Valid or invalid
- Inside or outside the target sector
- Relevant or irrelevant to the target service
- Accepted or rejected by sales
- Converted to an opportunity or not
Do not move unnecessary personal data into reporting systems. Apply the organization’s privacy and access policies.
Create a measurement card for every KPI
Complete the following fields before a KPI enters the report:
| Field | Example |
|---|---|
| KPI name | Owned-source rate |
| Definition | Share of valid prompt tests showing a company-owned URL as a visible source |
| Data source | Dated controlled prompt records |
| Scope | ChatGPT Search, English, United Kingdom, 20 decision queries |
| Period | 1–31 October 2026 |
| Baseline | First measured value |
| Target direction | Increase; no guaranteed fixed value |
| Limitation | The sample does not represent every user query |
| Owner | SEO/GEO analyst |
| Retest | Monthly, using the same core query set |
This card prevents teams from changing the sample between months and presenting the difference as improvement.
Structure a monthly GEO report
1. Executive summary
- Business objective being monitored
- Material verified changes
- Platform data versus controlled observation
- Unresolved uncertainty
- Three actions for the next period
2. Technical eligibility
- Status of critical URLs and crawler access
- New or resolved blockers
- Remediation and retest evidence
3. Observed visibility
- Mention and owned-source rates by query group
- Correct and incorrect service associations
- Competitor and source-type observations
- Changes to the platform or sample
4. Official platform data
- Dedicated Search Console generative AI data, if available
- General Google Search performance where relevant
- Bing AI Performance citation and page data
- Availability and scope notes
5. Behaviour and conversion
- Recorded referral and organic sessions
- Landing-page engagement
- Conversions and quality classifications
- Tracking or attribution problems
6. Decisions and worklist
Connect every recommendation to a finding: issue, evidence, action, owner, due date and remeasurement method.
Our guide to website maintenance and SEO responsibilities can help distinguish ongoing visibility analysis from routine platform maintenance.
Do not confuse change with causation
Citations may rise after an article is updated. The sequence alone does not prove that the edit caused the increase. Demand, model changes, data refresh delays, competitor content and platform sampling may also affect the observation.
Prefer careful language:
- Instead of “The edit increased citations by 30%,” write: “Reported citations were higher in the 30 days after the edit than in the preceding 30 days; the platform data does not isolate a single cause.”
- Instead of “GEO generated 12 sales,” write: “Analytics recorded 12 forms associated with the defined AI-referral sources; lead quality and multi-touch influence require separate review.”
A causal claim requires an appropriate test design, comparison, control of other variables and enough data. Routine monthly reporting usually supports observational trends.
Compare competitors by context
Do not reduce competitor analysis to total mentions. Ask:
- Which query groups contain the competitor?
- Is the brand, service page or editorial resource being cited?
- Is the source based on first-party data, a case, product page or third-party publication?
- Is the mention accurate, neutral, positive or out of context?
- Is an owned URL cited directly?
Visibility does not prove a competitor’s sales, market share or quality.
A 30–60–90-day measurement rhythm
Kumsal Ajans’ confirmed SEO/GEO workflow can be translated into a measurement rhythm.
Days 1–30: establish the baseline
- Technical status, URL scope and crawler policies
- Organic impressions, clicks, sessions and conversions
- Initial prompt/query sample
- Availability of official platform reports
- Baseline competitor observations
Days 31–60: implement and record changes
- Technical remediation
- Content and page improvements
- URL, date and owner for every material change
- Measurement-tag and conversion checks
- Early observations without claiming an outcome
Days 61–90: compare and identify opportunities
- Remeasure using the same method
- Interpret platform data, prompt observations and site behaviour together
- Identify content opportunities for wrong or missing brand associations
- Review conversion quality and technical status
- Define the next testing and update cycle
Ninety days is not a guaranteed time to results. It is an operational period for establishing a baseline, applying work and comparing observations with a consistent method.
Common measurement mistakes
Using one visibility score
An unexplained score hides data sources, weighting and sample limitations. Show the layers separately.
Changing the prompt set every month
Add exploratory queries when needed, but preserve a comparable core set and disclose additions or removals.
Treating citations as visits or conversions
A citation indicates a visible source. Clicks, sessions and conversions are separate events measured in other systems.
Assuming a third-party tool has internal platform data
Tools can provide dated observations and workflow support. They do not thereby gain access to a platform’s private ranking or AI-system metrics.
Reporting percentages without the sample
Always show the denominator and test conditions, especially with a small sample.
Start with five measurement cards, not another tool
AI visibility measurement is a chain connecting technical eligibility, observed brand and source visibility, official platform data, site behaviour and business outcomes. Those signals answer different questions and should not be collapsed into one score.
Begin by creating definition cards for five core KPIs. Record the source, scope, period, baseline and limitation of each. Future reports can then describe measured change without turning it into a guarantee.