


Aydınlatma metni yükleniyor…
A report that says only “the app crashed” or “the screen loaded slowly” rarely gives a development team enough context to act. The same failure may occur only on a particular Android device, an older iOS version, a weak mobile connection or the latest app release. An effective mobile app performance monitoring plan must therefore show more than the number of errors: it should reveal which users, screens, releases and operating conditions are affected.
A well-designed monitoring system gives product, operations and engineering teams a shared basis for decisions. The goal is not to treat every technical event as equally urgent. It is to identify problems that disrupt important user journeys, provide the responsible team with actionable evidence and confirm whether a fix produces a measurable improvement.
How should you define the scope of a monitoring plan?
Start by mapping the journeys that matter most to users and the business. Registration, sign-in, product search, checkout, order submission, document upload and field-record completion do not carry equal importance. A delay on an introductory screen and a crash during payment approval require different priorities, even when they generate the same number of events.
For every critical journey, document its screens, service calls, device features and success conditions. This turns an ambiguous complaint such as “the app is slow” into a testable finding: “On a defined group of Android 14 devices, the cart screen’s p95 time to usability exceeds its target in app version 5.2.0.”
Business objectives, user needs and technical requirements should be assessed together at this stage. Kumsal Agency’s approach to React Native mobile app development for iOS and Android treats an app as more than a collection of screens. Data flows, integrations, operational requirements and long-term maintainability are considered as part of the product.
Create a shared measurement dictionary
Different tools can calculate the same-sounding metric with different denominators. One platform may calculate a crash rate against daily active users, while another uses sessions. Google also explains that Android vitals and SDK-based tools can produce different results because their event coverage and rate calculations differ. Document the name, definition, numerator, denominator, reporting period and data source for every metric.
Stability metrics
- Crash-free user rate: The percentage of unique users who did not experience a crash during the selected period.
- Crash-free session rate: The percentage of sessions completed without a crash.
- User-perceived crash rate: The effect of crashes that occur while users are actively engaging with the app.
- ANR and freeze rate: Instances in which an Android app stops responding or the interface remains blocked beyond a defined duration.
- Affected users per issue group: The number of distinct users affected by events attributed to the same likely root cause.
Google Android vitals identifies user-perceived crash and ANR rates as core stability metrics. Google Play’s bad-behaviour thresholds can be monitored as external boundaries that may affect store visibility. However, internal targets should usually be stricter and tailored to the importance of each user journey.
Screen and network performance metrics
- App start time: Measure cold and warm starts separately.
- Time to usable screen: Measure from the start of navigation until essential content is visible and interactive.
- p50, p75, p95 and p99 durations: Use percentiles to reveal slow user segments that an average can hide.
- Slow and frozen frame rate: Track loss of fluidity during scrolling, animation and screen transitions.
- API response time and error rate: Help distinguish delays in the mobile client from network or back-end service problems.
The Firebase Performance Monitoring documentation describes the collection of app-start, screen-rendering and network-request data, alongside custom traces for specific code paths. Automatic measurements provide a useful foundation, but product-specific operations such as payment confirmation, media processing or offline synchronisation need custom traces and explicit success criteria.
Add decision-ready context to every event
A crash record should include a symbolicated stack trace, error type and timestamp, together with the app version and build number. Operating-system version, device model, memory class, screen name, preceding user action, connection type and relevant service response can greatly reduce investigation time. Use anonymous or pseudonymous identifiers instead of logging raw data that reveals a user’s identity.
On iOS, retain the symbol files associated with every production build so crash reports can be interpreted correctly. Apple’s official guidance on diagnosing issues with crash reports and device logs is the primary reference for reviewing these reports in application context. On Android, securely retain the mapping files for releases that use code shrinking or obfuscation.
In React Native projects, JavaScript errors and crashes in the native iOS or Android layers should be linked through a consistent event model. Standardising release, screen and journey names across platforms makes it easier to distinguish problems caused by shared code from platform-specific failures. The same taxonomy should also be used by analytics, support records and release dashboards whenever practical.
Diagnostic context must remain safe. Do not record passwords, access tokens, payment credentials or unrestricted request bodies. Apply allowlists, masking and retention rules to logs, and verify them whenever a data schema or integration changes.
Analyse release, device and connection segments together
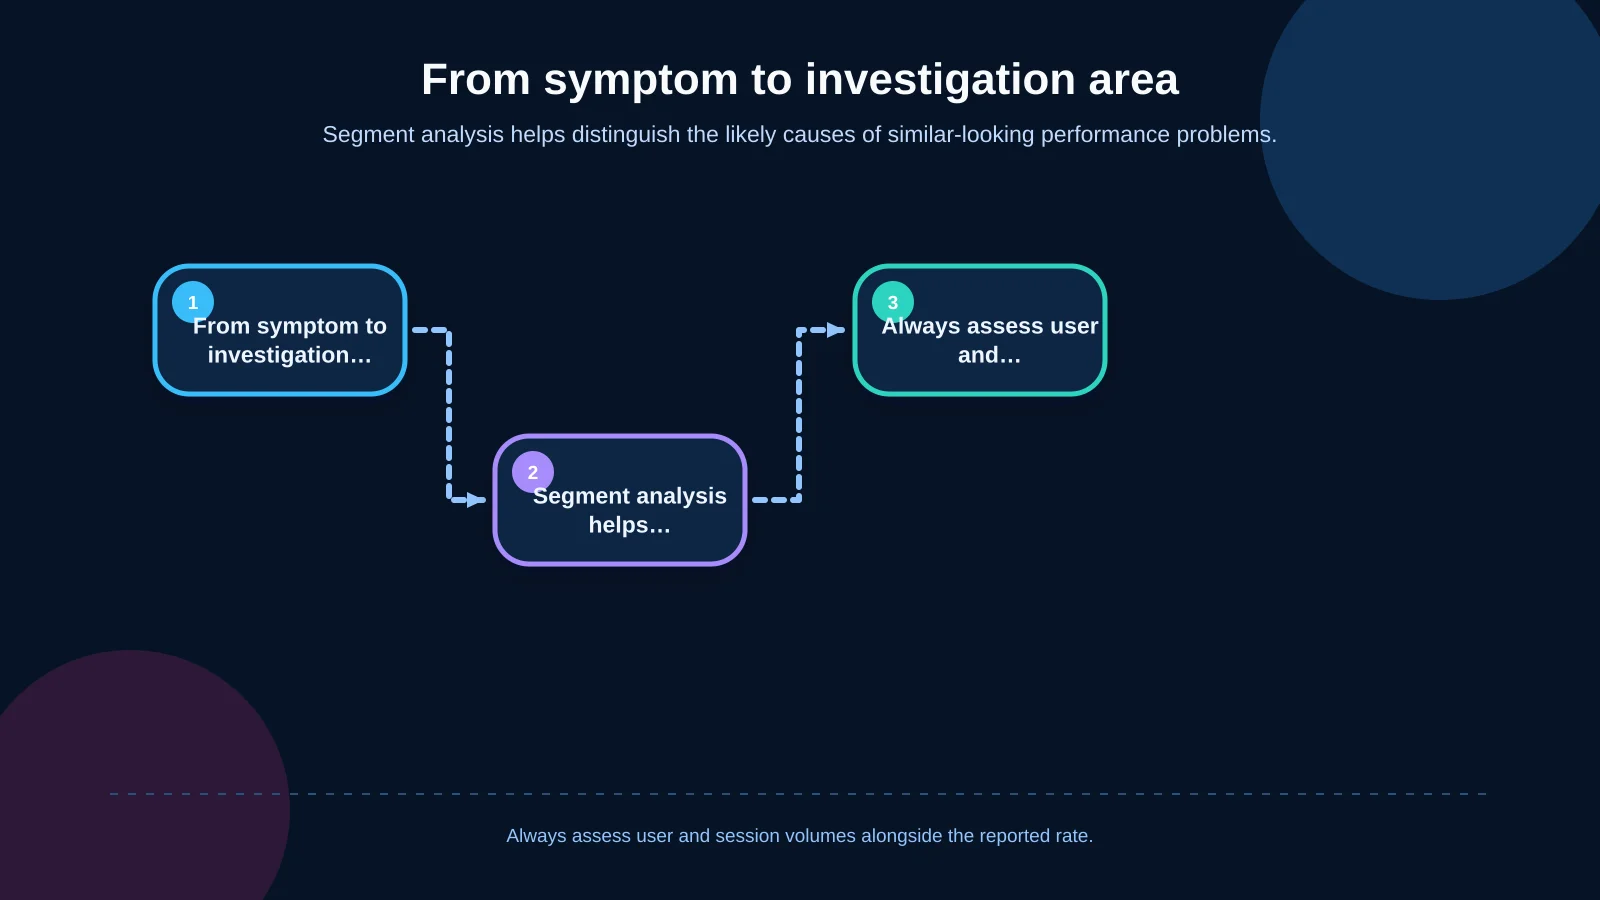
Overall averages are not reliable enough on their own. Analyse incidents by app version, major operating-system version, device model, memory class, country or region, and Wi-Fi or cellular connection. Because rates based on tiny samples can be misleading, display event, user and session counts beside every percentage.
The first comparison should usually be between releases. If the crash-free user rate falls after a new version is published, the team may pause the rollout or assess whether a rollback is possible. When failures cluster around one device family, investigate memory pressure, graphics behaviour and platform-specific code. Screen times that deteriorate only on weak connections can point towards request size, caching, timeout or retry-policy problems.
Segments should also be intersected. “There is a problem on Android” is too broad to guide an investigation. “The catalogue screen is slow in version 5.2.0 on cellular connections for devices with less than 6 GB of memory” sharply narrows the search area. Dashboards should express these findings in language that product and operations teams can understand, while still allowing engineers to inspect the underlying evidence.
| Symptom | Priority segment | First investigation |
|---|---|---|
| Increase after a new release | App version | Code changes and rollout |
| Increase on specific models | Device and memory | Memory and platform code |
| Increase on older systems | Operating system | Compatibility and API usage |
| Slow performance on cellular | Connection type | Requests, caching and timeouts |
Design alert thresholds around business impact
There is no single universal threshold for every metric or screen. First establish a baseline from several weeks of healthy operation, accounting for normal changes in traffic and device mix. Then define target, warning and critical levels for the journeys that matter. A small but persistent deterioration on a payment screen may deserve attention before a short-lived spike on a low-value information page.
An alert rule should combine rate, volume and duration. Instead of notifying the team whenever an error percentage crosses a threshold, require it to affect a minimum number of users and persist across several measurement intervals. The exception is a clear failure of a critical journey in a new release, where waiting for statistical certainty could increase business and user impact.
Use more sensitive release guards during the first hours of a staged rollout. Compare the new version’s crash-free user rate with the previous version and pause distribution if a critical issue group grows quickly. Define the alert owner, communication channel, response target and out-of-hours escalation path in advance. If excessive notifications cause alert fatigue, review grouping logic, minimum volumes and thresholds rather than allowing important warnings to blend into background noise.
Incident response from alert to verification
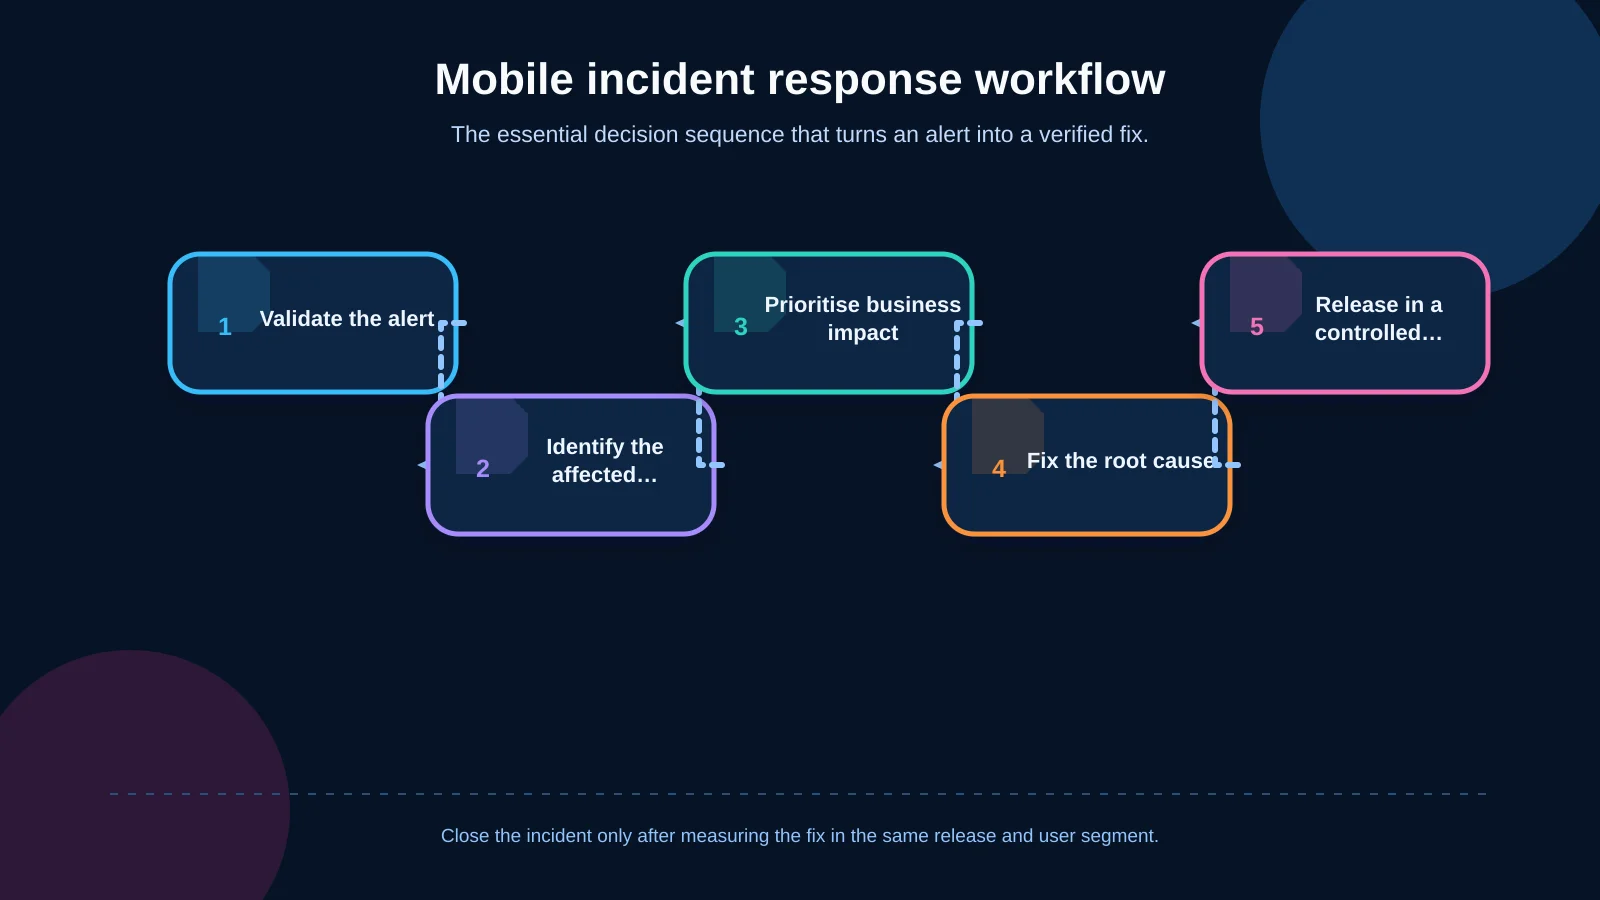
When an alert arrives, first confirm that the event is genuine and determine its scope. Rule out telemetry outages, duplicate reporting and insufficient sample sizes. Then identify the affected version, devices, screens, connection conditions and user volume. Prioritise the incident according to user impact, disruption to critical transactions, growth rate and the availability of a workaround.
Next, provide engineering with a concise evidence package. It should contain the symbolicated stack trace or performance trace, reproduction steps, recent user actions, relevant service responses and a release comparison. Good evidence shortens the path to a hypothesis without exposing personal data or credentials in production logs.
Verify the fix in a test environment using the relevant device and network conditions, then release it through a controlled rollout. Closing the error ticket is not sufficient. Monitor the same segments in the new version and confirm that the metric has returned to its baseline without creating a regression elsewhere.
Record the root cause, containment action, permanent fix and monitoring change in a short review. If the incident exposed missing context or an ineffective threshold, update the event schema and alert policy. This turns each incident into an improvement to the monitoring system rather than an isolated repair.
How should dashboards and ownership be structured?
An executive or product view should summarise crash-free users, critical-journey success, the user impact of slow screens and release trends. An engineering view should provide issue groups, stack traces, device distributions, network requests and version comparisons. An operations view should show open incidents, affected transactions, available workarounds, ownership and communication status.
Every metric needs an accountable owner. A product manager can assess business impact and priority; a technical lead can own root-cause analysis; operations can coordinate user communication; and quality teams can verify the fix. Telemetry checks should form part of release acceptance criteria so schema changes, SDK updates and integration work do not silently break measurements.
Ownership also needs explicit hand-offs. An alert without a named responder is only a notification, while a resolved engineering task without operational confirmation may leave affected users unsupported. Define who declares an incident, who can pause a rollout, who approves recovery and who closes the event after measured verification.
Mobile app monitoring implementation checklist
- Classify critical journeys and screens by business and user importance.
- Define crash, ANR, freeze, startup, screen and network performance metrics.
- Document each metric’s numerator, denominator, data source and reporting period.
- Standardise release, device, operating-system and connection dimensions.
- Retain symbol and mapping files for every production build.
- Remove or mask personal, sensitive and credential data in event records.
- Measure healthy baselines and define warning, critical and rollout-stop thresholds.
- Document incident ownership, response targets, escalation and verification duties.
- Test telemetry itself as part of release acceptance.
- Measure improvement in the same user segment after every fix.
A measurable and sustainable mobile experience
Mobile app monitoring is not simply the installation of an error-reporting tool. A useful plan connects user journeys with technical telemetry, release management with incident response, and performance goals with business priorities. This helps teams focus on the problem causing the greatest user and operational impact, rather than whichever error happens to generate the most noise.
Kumsal Agency plans React Native iOS and Android products together with custom web software, data flows and integration requirements. Its approach centres on measurable user experience, project-specific development, modern security standards and dependable software infrastructure. To define crash and performance metrics, release and device segments, alert thresholds and a practical response workflow for your mobile product, contact Kumsal Agency.