


Aydınlatma metni yükleniyor…
A good B2B dashboard is not a collection of charts designed to fit as much data as possible onto one screen. It is a decision-making tool that gives sales, finance, warehouse, purchasing and management teams reliable answers to different operational questions. At a glance, each user should be able to understand what is progressing normally, what requires attention and which action should come next.
Dashboard design therefore begins with business goals, user roles, decision points and data sources—not colours or chart types. When order, sales, inventory, shipment and collection data are presented without a shared context, the operation may remain difficult to understand despite the abundance of metrics. A decision-focused approach organises information around the user’s responsibilities and creates an uninterrupted path from the summary to the underlying cause, the relevant business record and the next action.
Why Should Dashboard Design Not Begin with Chart Selection?
The first question should not be “Which charts should we use?” but “Which decision must the user make here?” A sales manager may need to identify target variance, declining accounts and orders blocked by credit limits. A warehouse manager is more likely to focus on orders awaiting preparation, inventory shortages and delayed picking tasks. Finance teams need visibility into overdue receivables, credit exposure, payment matching and reconciliation discrepancies. Giving every role the same metrics increases information volume while often slowing down decisions.
Nielsen Norman Group describes dashboards as collections of visualisations that present information at a glance so users can act quickly. Its discussion of how to make dashboards easier to understand also highlights the different purposes served by operational dashboards and analytical dashboards. In practice, a current shipment failure and a monthly sales trend should not occupy the same level of urgency in a B2B management panel.
The starting point should instead be a documented set of decisions, owners and response times. If a metric does not help someone recognise a condition, investigate its cause or initiate a response, it may belong in a detailed report rather than on the main dashboard.
Decision-Focused Dashboard Planning Process
Successful dashboard design is built on a short but disciplined discovery process completed before interface production begins. Existing reports, manually maintained spreadsheets, ERP screens, notification channels and questions raised in daily meetings should all be reviewed. This separates information that is merely available from information that genuinely supports operational decisions.
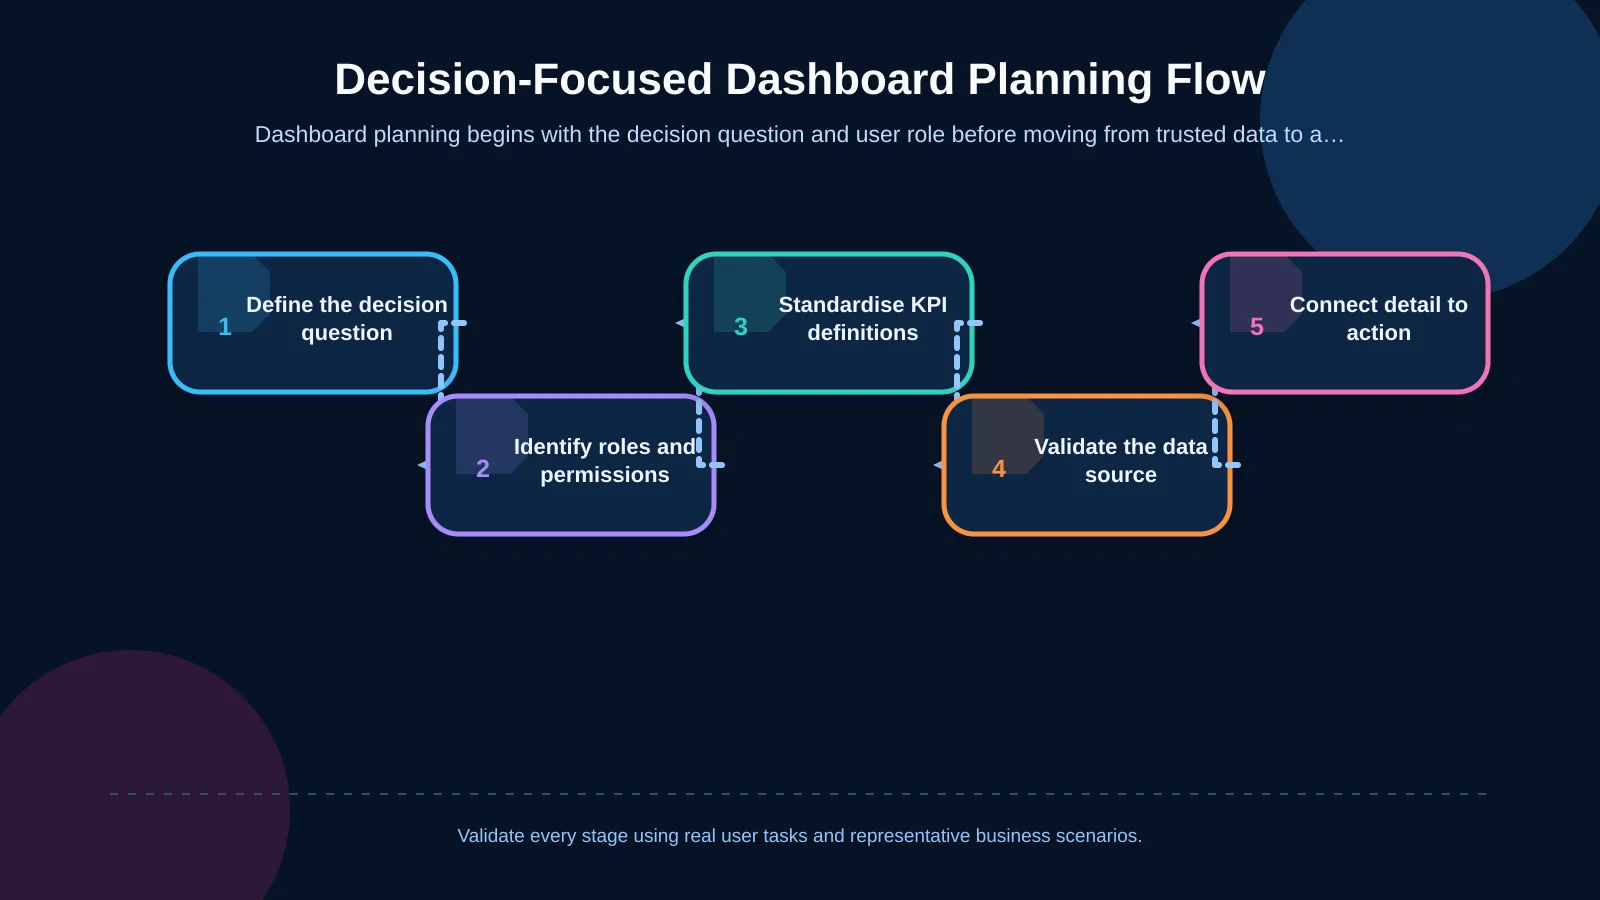
1. Define the Business Goal and Decision Question
Replace broad requests such as “show sales” with questions that can be answered and acted upon: Which region is falling behind its target? Which orders cannot be shipped because of unavailable inventory? Which customers present a collection risk this week? Each question should be connected to a user, timeframe, comparison basis and possible action.
2. Separate User Roles and Permissions
Role analysis determines much more than menu visibility. KPI order, default filters, level of detail and permitted actions should also vary by role. Senior management may need company-wide totals and the causes of major variances, while a regional manager should see only the customers and orders within their remit. Sensitive cost, margin and account-balance fields must remain unavailable to users whose work does not require them.
3. Standardise KPI Definitions
A dashboard loses trust when “net sales,” “available inventory” or “late order” means something different to each department. Every KPI should have a documented formula, data owner, refresh frequency, currency, time zone, exclusion rules and target value. Users should be able to access that definition from the interface when clarification is needed.
4. Connect the Summary to Detail and Action
A critical card should do more than report “12 delayed shipments.” Selecting it should reveal whether those delays relate to a warehouse, product, carrier or customer and then lead to the filtered order records. Without losing context, an authorised user should be able to assign an owner, approve a request, add a note or open the corresponding ERP record.
5. Validate the Prototype with Real Scenarios
Wireframes and clickable prototypes should be tested with representative users before development. Tasks such as “find the critical order,” “explain the reason for the collection risk” and “assign an owner to the inventory problem” reveal whether the hierarchy and navigation support actual work. Prototyping also gives stakeholders an opportunity to align requirements before expensive integration and development decisions are fixed.
Information Architecture: Status First, Then Cause, Then Action
A dashboard that supports decisions can be organised into three layers. The first presents a limited number of role-critical KPIs and alerts. The second uses trends, comparisons and breakdowns to explain why a condition exists. The third provides the filtered records and actions required to resolve it. This structure lets users move from a summary card to a real business record without becoming lost across separate reports.
The top area might contain revenue, order fulfilment rate or overdue receivables, depending on the role. A middle section can present target-versus-actual comparisons and changes over time. Work queues for pending approvals, critical inventory and integration failures can appear below or alongside them. Components should be prioritised by urgency and commercial impact rather than by the organisation chart.
Consistency remains important across these layers. Filter state, terminology and time ranges should carry through from the overview to the detailed record. If a user selects one warehouse and the current week, the drill-down view should preserve both conditions and make them clearly visible.
Which Information Should Take Priority for Each Role?
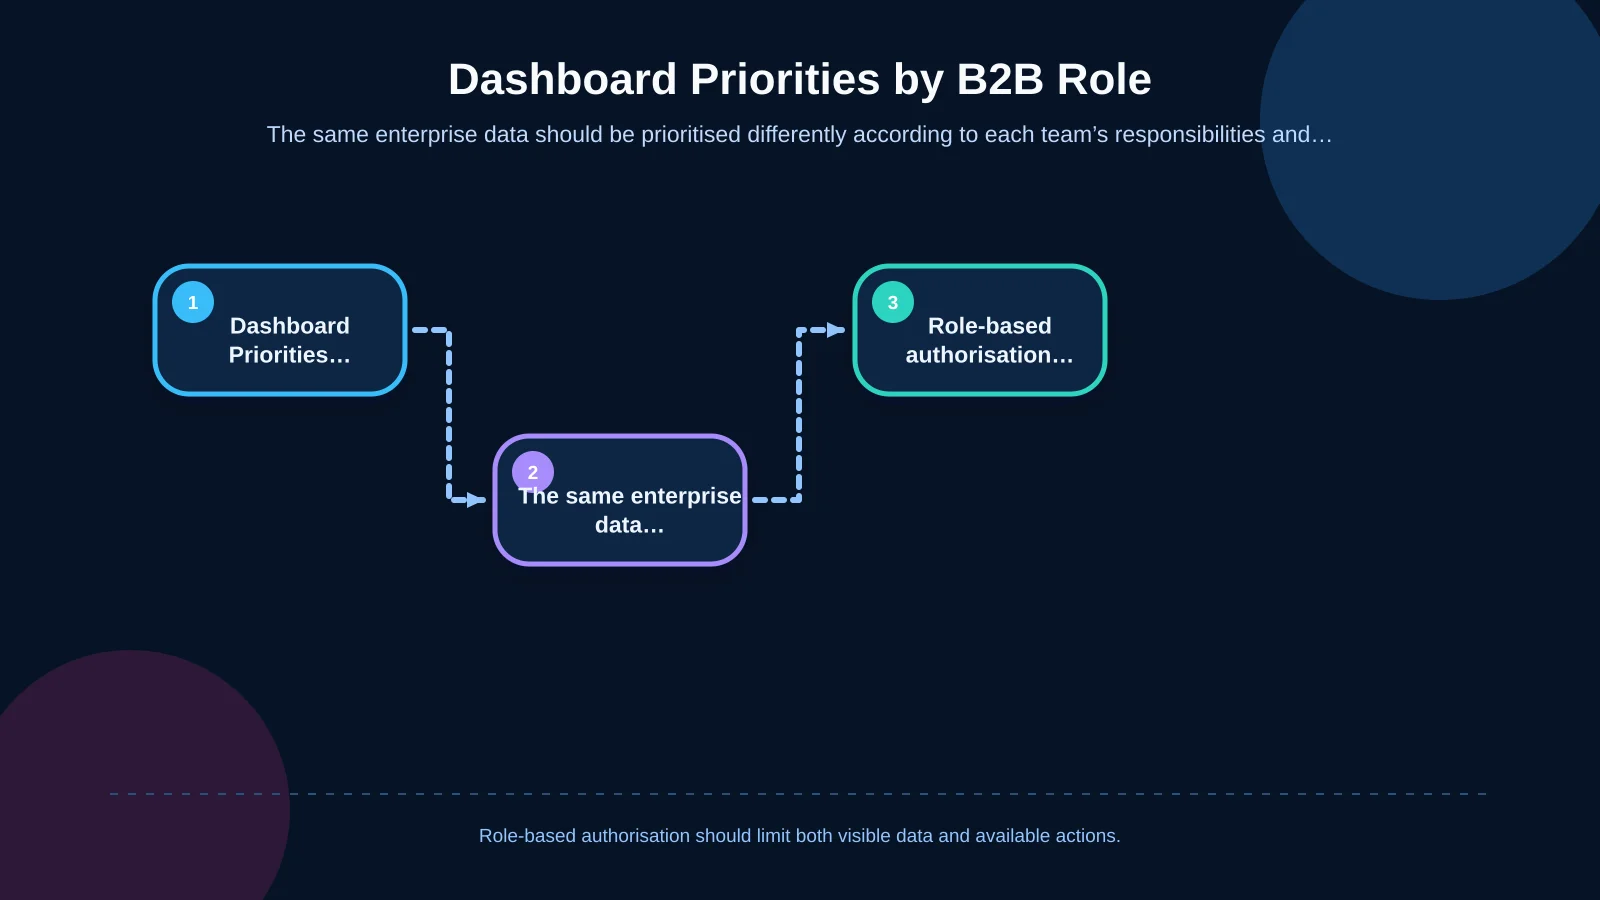
One shared data model can support different views for different responsibilities. The aim is not to build disconnected dashboards, but to present the same commercial reality through the decision framework appropriate to each team. Personalised home screens should retain common definitions, consistent filters and traceable source records.
- Sales: Target versus actual performance, quote-to-order conversion, customer activity, lost sales and orders held because of account limits.
- Finance: Overdue receivables, collection forecasts, credit exposure, payment matching and reconciliation differences.
- Warehouse and logistics: Orders awaiting preparation, missing products, picking delays, partial shipments and carrier exceptions.
- Purchasing: Critical inventory, open purchase orders, supplier delays and forecast requirements.
- Management: Company targets, profitability, cash risk, operational capacity and material variances.
These distinctions must be implemented through user groups, permissions and data scopes. A project-specific web development approach can reflect real responsibilities, approval rules and access boundaries instead of forcing the business into a fixed reporting template.
| Role | Priority Metric | Critical Exception | Expected Action |
|---|---|---|---|
| Sales | Target and conversion | Order held at credit limit | Review the customer or order |
| Finance | Overdue receivables | Payment-matching discrepancy | Assign a collection owner |
| Warehouse | Orders awaiting preparation | Inventory shortage or delay | Reschedule picking and shipment |
| Purchasing | Critical inventory | Supplier delay | Expedite the purchase order |
| Management | Profitability and cash risk | Target variance | Identify the cause and owner |
A KPI Card Is Not Enough on Its Own
A KPI becomes meaningful only when its value is accompanied by context. A card showing “£4.8 million in sales” does not support a decision unless the target, previous period, data timestamp and included scope are known. The card should present the current value, comparison, variance and direction of travel, while its detail view should explain the calculation. If percentage change is shown, users should also be able to see the baseline and comparison period.
Every KPI should have an owner and an expected response. When available inventory falls below a threshold, for example, the dashboard could show the affected open orders, expected replenishment date and responsible team instead of displaying only a red warning. The indicator then becomes an operational control point rather than a passive report.
Exception Management Should Be at the Centre of the Dashboard
Much of a B2B operation can progress automatically under normal conditions; human attention is generally most valuable when something deviates from the expected flow. A dashboard should therefore classify exceptions as carefully as it reports successful outcomes. Insufficient inventory, ERP transfer failures, overdue approvals, credit-limit breaches, failed payments and delayed shipments can be managed through a common exception queue.
Each exception should display severity, creation time, commercial impact, responsible owner, latest activity and recommended next step. Repeated notifications for the same event should be consolidated to avoid alert fatigue. Severity must not be communicated by colour alone. The W3C’s WCAG guidance on the use of colour requires meaning to be available through another visual or textual cue. A critical label, warning icon and concise explanation can therefore work together.
Teams also need clear rules for acknowledgement, assignment, escalation and closure. The dashboard should distinguish a new problem from one already being handled and retain enough history to show who acted, when they acted and what changed.
Building Data Trust Across ERP and Business-System Integrations
A dashboard is only as useful as the freshness and consistency of its underlying data. If orders originate in the ERP, shipments in a warehouse system, payments in banking services and customer information in the CRM, the authoritative system for every important field must be identified. Field mappings, synchronisation frequency, failed-transfer policies and reconciliation controls belong within the project scope.
Users should be able to see the last refresh time, missing-data warnings and active filters. If an integration is delayed, the interface should identify the data as stale instead of presenting an old value as current. Kumsal Agency’s enterprise resource planning services address connected finance, sales, inventory, purchasing and operational processes around shared business data.
The analytical layer also requires a coherent model. Microsoft’s guidance on star schema design recommends separating fact tables containing events and measurements from dimension tables used for filtering and grouping. Orders, inventory movements and collections may operate at different levels of detail; combining them carelessly can distort totals and undermine KPI accuracy.
Usability in Chart, Table and Filter Selection
The visual format should match both the structure of the data and the user’s question. A line chart suits change over time, while a bar chart supports comparison between categories. When users need to inspect exact records, sort them or take action on them, a table is usually more appropriate. Decorative pie charts, three-dimensional effects and unnecessary animation make rapid scanning harder.
Filters should preserve the decision context. It must be clear which components are affected by shared filters such as date, company, warehouse, region and customer. Defaults can vary by role, but active filters should remain visible and be resettable in one action. Saved views may reduce repetitive work for users who perform the same investigation regularly.
Responsive behaviour also needs deliberate planning. On smaller screens, the interface should preserve urgent status, essential filters and primary actions rather than simply shrinking the desktop layout. Dense tables may require prioritised columns or a record-detail view.
Security, Performance and Long-Term Maintainability
Authorisation cannot consist solely of hiding cards in the interface; it must also be enforced by the server and data layers. Role-based access, company or regional scope, sensitive-field masking, action logging and approval controls should be designed together. An audit trail should answer who viewed sensitive data, changed a record or approved a decision.
Performance is equally part of the user experience. Decision-critical summaries should load quickly, while expensive details can be retrieved when requested. Precalculation, caching, pagination and query optimisation may be appropriate for large data sets. Because KPI definitions, integrations and business rules will evolve after launch, the platform should use modular, testable and documented components.
How Should Dashboard Project Success Be Measured?
Success should not be measured only by the number of dashboard visits. More useful indicators include the time required to notice a critical condition, clicks needed to reach a decision, time spent preparing manual reports, age of unresolved exceptions and frequency of data-quality reports. Repeated CSV exports followed by work outside the platform may expose a missing filter, insufficient detail or absent action.
After launch, usage analytics, support requests and short user interviews should be assessed together. Unused cards can be removed, frequently requested breakdowns can be promoted and misunderstood KPIs can be redefined. The dashboard then becomes a digital product that develops alongside the operation rather than a one-off interface delivery.
The Next Step for a Decision-Focused B2B Management Dashboard
Effective dashboard design brings business goals, roles, data definitions, exceptions, integrations and action paths into one system. A management panel creates real value when users can see not only what happened, but why it happened and what they should do next. This approach gives B2B e-commerce, dealer portals, customer portals and ERP-connected operations a shared and actionable view.
Kumsal Agency treats a dashboard not as an isolated screen filled with ready-made charts, but as a project-specific management product combining information architecture, user experience, brand-specific interface design, role-based authorisation and reliable software infrastructure. To plan a decision-focused management panel around your B2B processes, user roles and integration requirements, contact Kumsal Agency.