


Aydınlatma metni yükleniyor…
Sustainability reports bring together a broad set of information, from environmental impacts and workforce policies to governance indicators, targets and progress data. When all this content is confined to a static PDF running to hundreds of pages, however, different stakeholders may struggle to find, understand and compare what matters to them. An investor may be looking for a specific performance indicator, an employee for social-impact programmes and a customer for the environmental approach behind a product. Sending every visitor through the same linear document cannot fully address these different intentions.
Turning a sustainability report into an interactive web experience involves much more than splitting a PDF into separate pages. The objective is to reorganise dense information around user needs, make the relationship between evidence and narrative clear, and place the content within a sustainable system that the organisation can manage over time. A well-planned experience does not necessarily replace the approved report or downloadable PDF. It adds an accessible, searchable and measurable publishing layer that supports different reading habits.
Why might a static PDF not be enough?
A PDF remains valuable for archiving a report, preserving an approved version for a reporting period and allowing the complete document to be downloaded. Yet reading wide tables on a mobile screen, locating one indicator among hundreds of pages or comparing results across years can be demanding. Search engines may process the file, but a PDF offers limited scope for taking users directly to the right context and guiding them towards a relevant next step.
A web experience can make the same material accessible by topic, stakeholder, target, period, location or indicator. Visitors can explore only the section they need, narrow the data through filters, compare reporting periods in charts and open the methodology without leaving the context. Sharing also becomes easier: instead of referring someone to a file and page number, a user can send the URL of the relevant topic or dataset.
The important distinction is between digital presentation and structured data. The GRI Sustainability Taxonomy supports machine-readable structuring of disclosures under the GRI Standards through XBRL. An interactive website can connect such a data foundation with human-centred navigation, narrative and visual explanation. Applicable reporting standards, assurance requirements and formal filing obligations must still be assessed separately for each organisation.
Start the transformation with content and user analysis
The first decision should not concern colour, animation or chart style. It should establish who the report serves and which questions it must answer. Investor relations teams may prioritise comparable performance and risk information, while sustainability teams need to explain target boundaries, calculation methods and progress. Employees, candidates, customers, suppliers, regulators and the media will each arrive with different priorities.
Stakeholder analysis defines each group’s central question, the evidence it needs and its likely next action. The existing report can then be inventoried as text, datasets, tables, charts, case studies, policies, methodologies and downloadable documents. For every item, record its owner, source system, update frequency, language status and approval responsibility. This exposes missing material, duplication and conflicting figures before interface design begins.
A page-by-page content matrix can document the scope while connecting content types to components and owners. When the same indicator appears in multiple report sections, assigning one authoritative source prevents discrepancies during future updates. This analysis also helps distinguish reusable information from narrative that belongs to a particular reporting period.
Steps for moving from a PDF to an interactive web experience
A sound transformation does not treat design and development as decorative tasks added when the report is almost complete. Content modelling, user journeys, data sources and publishing responsibilities should evolve together.
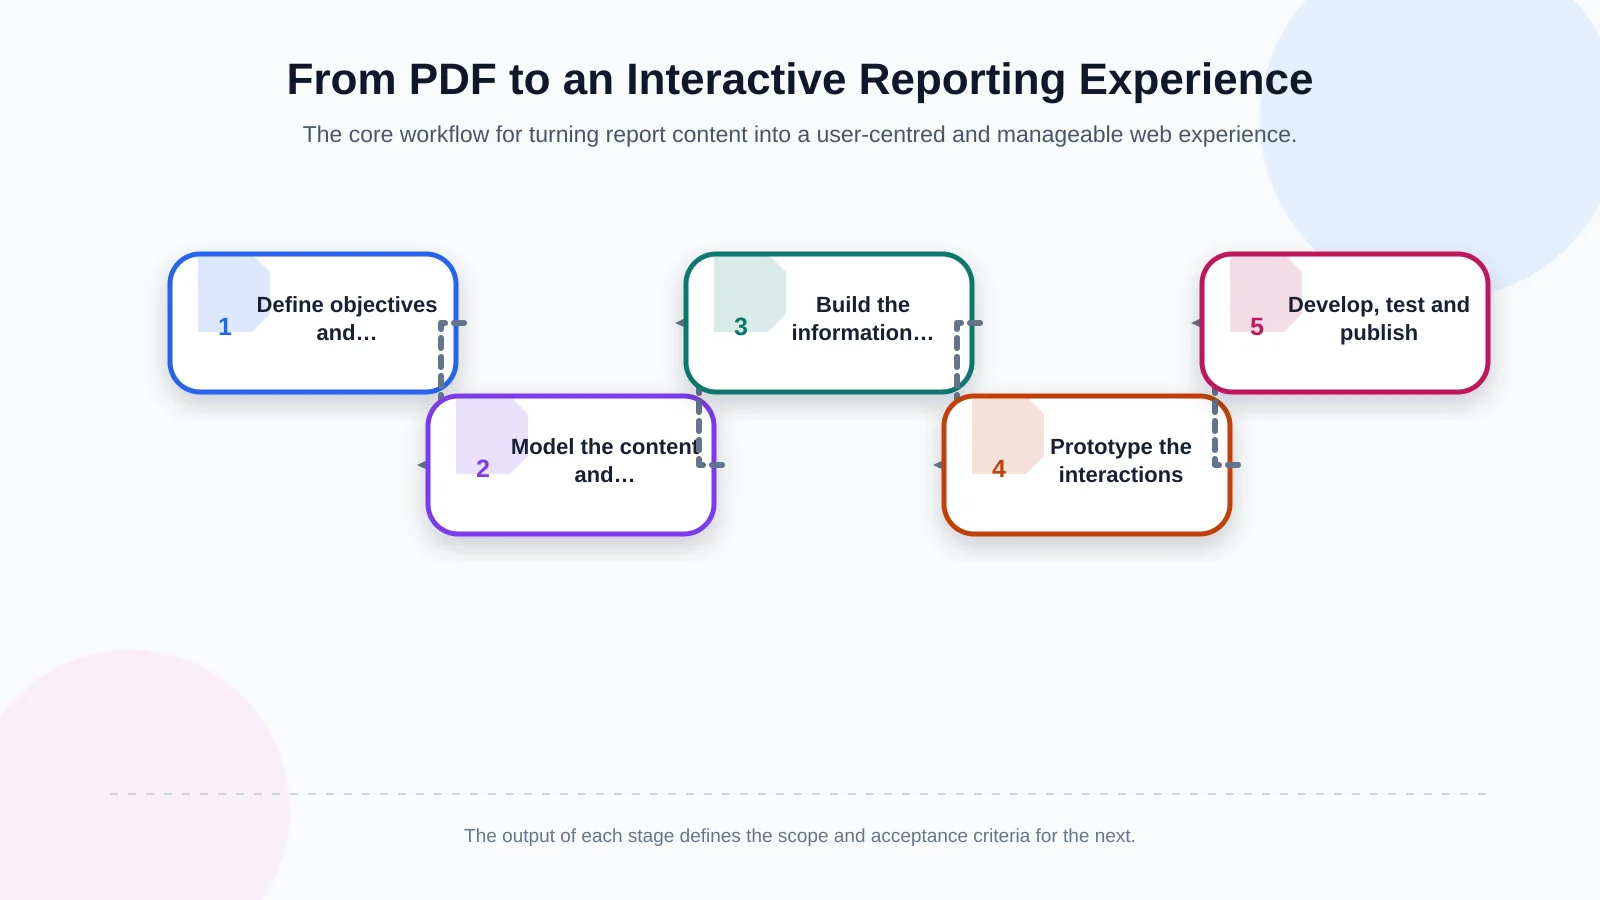
1. Define objectives and success measures
A goal such as “digitise the report” is too broad to guide scope. Define measurable outcomes instead: making priority indicators easier to reach, serving localised content to international stakeholders, increasing data downloads or improving engagement with selected subjects. Connect each objective to an audience, a user action and an observable measure. These decisions determine which interactions are genuinely useful and which can be postponed.
2. Break the report into a modular content model
Move beyond a linear structure made only of chapters. Model reusable fields such as commitments, indicators, actual values, units, periods, boundaries, methodology notes, case studies and related policies. The same approved value can then appear consistently in an executive summary, topic detail and comparison chart. A modular model also makes corrections, translation and future reporting cycles easier to govern.
3. Build information architecture around user tasks
The main navigation does not need to reproduce the PDF contents page. Topic gateways such as Climate and Energy, People and Society, Responsible Value Chain and Governance can be supported by a performance summary, targets, data centre, methodology and downloads. On-site search, filters and related-content links become essential in a large report. Clear labels should reflect the vocabulary stakeholders use rather than the internal structure of the reporting team.
4. Validate interactions through prototypes
Test filters, charts, timelines and expandable explanations in a prototype before development begins. Observe whether users understand an indicator’s scope, can move between years and can locate its source or methodology. Prototyping makes expensive content and technical changes visible early. It should include realistic data and mobile states; placeholder cards rarely reveal problems caused by long labels, missing values or dense tables.
5. Develop, test and publish under control
Build the approved structure with reusable interface components and management functions suited to the project. Test data accuracy, browser support, mobile behaviour, accessibility, performance, analytics events and permission scenarios against separate acceptance criteria. Before launch, reconcile the web content with the approved PDF and record sign-off from the responsible teams. Release and rollback responsibilities should also be clear.
Use data visualisation to explain, not decorate
Advanced animation and interactive charts create value when they clarify a complex relationship. Suitable examples include emissions by scope and year, the remaining distance to a target or the distribution of impacts across a value chain. Three-dimensional charts, excessive movement and encoding based only on colour can instead make the evidence harder to interpret.
Every visualisation should answer four questions: what is being compared, which unit is used, what period does the data cover and how was the value calculated? Place a concise written summary, an unambiguous indicator name, the source and any boundary note beside the chart. Offering the underlying data in a downloadable format also allows analysts and researchers to reuse and verify it.
Animation should not run continuously merely to attract attention. Use it to reveal sequence, explain causality or show a meaningful change. Respect reduced-motion preferences, make controls operable by keyboard and ensure that users can obtain the same information without movement. Art Director-led visual direction can give the report a distinctive character while keeping evidence legible and central.
Plan accessibility, mobile experience and performance together
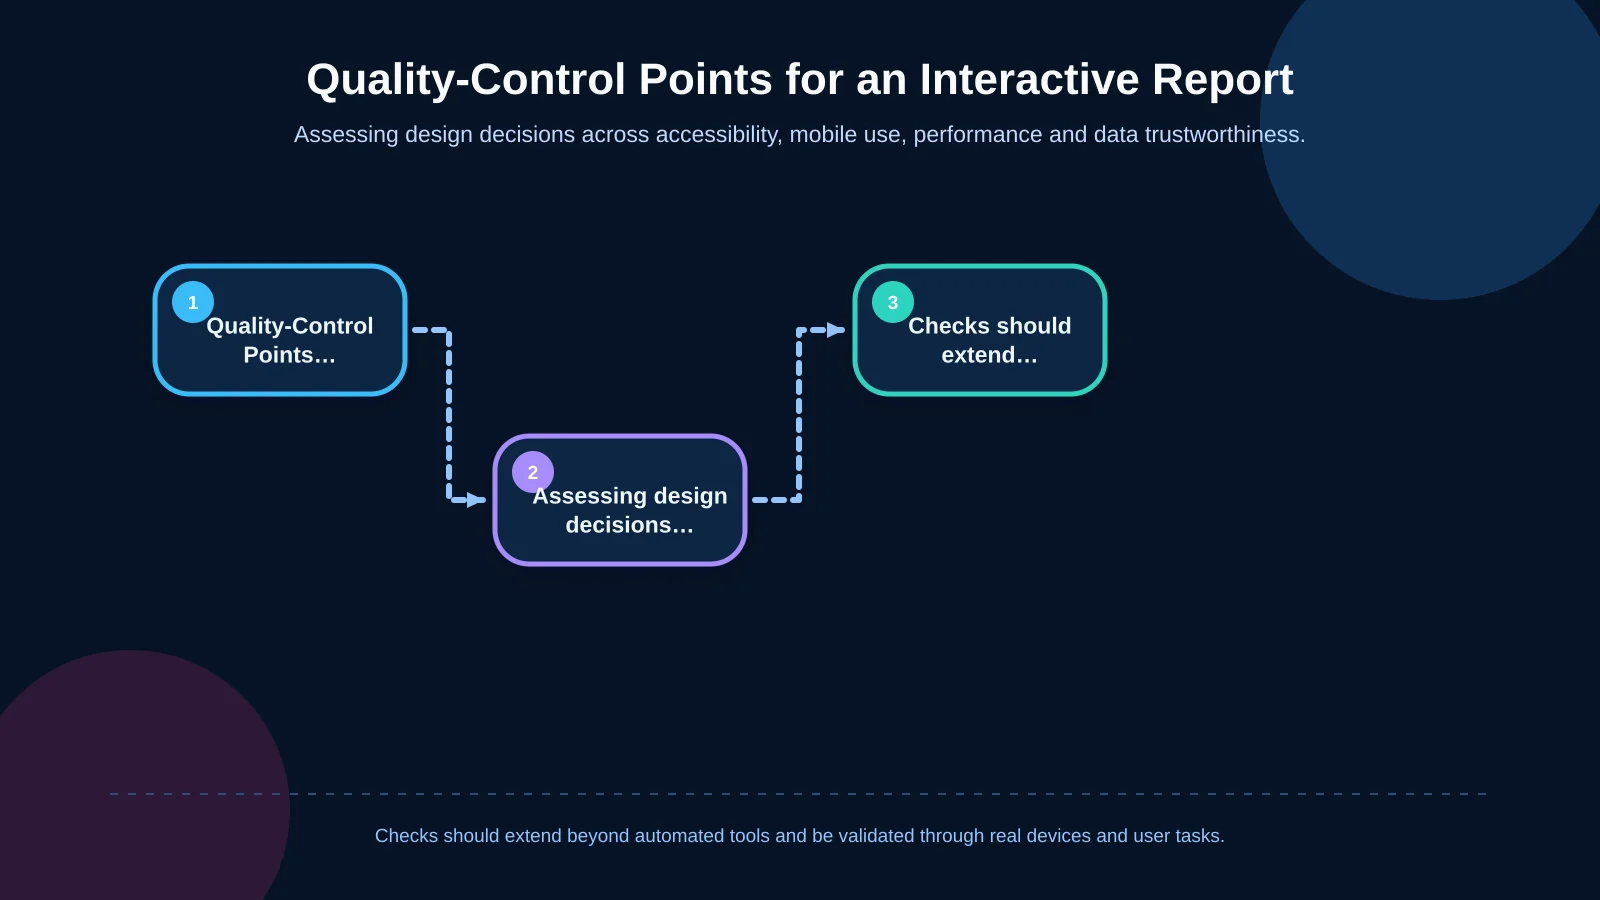
A sustainability message built around inclusion is also judged by the accessibility of its digital experience. The Web Content Accessibility Guidelines (WCAG) 2.2 provide testable criteria for content that is perceivable, operable, understandable and robust. Meaningful heading order, keyboard access, visible focus, text alternatives, sufficient contrast and cues that do not rely on colour alone should be part of the baseline.
Mobile support does not mean shrinking a desktop layout. Alternative presentations for long tables, readable chart descriptions, suitable touch targets and usable filter controls must be tested on real devices. The design system should also accommodate changing text lengths, local number and date formats, and potential right-to-left language requirements.
High-resolution media and heavy chart libraries can slow the experience. Google’s Core Web Vitals guidance evaluates loading performance through LCP, interaction responsiveness through INP and visual stability through CLS. Media optimisation, conditional loading, effective caching and measured JavaScript use are particularly important for mobile visitors. Set a performance budget alongside the design system and verify it with both laboratory testing and field data.
| Area | Check | Evidence | Risk |
|---|---|---|---|
| Accessibility | Keyboard, focus and contrast | Task-based testing | Content becomes inaccessible |
| Mobile use | Charts, tables and filters | Real-device testing | Loss of readability or interaction |
| Performance | LCP, INP and CLS | Field data and laboratory testing | Slow or unstable experience |
| Content trust | Unit, period and boundary | Source reconciliation | Misinterpretation |
How should multilingual publishing and the CMS be planned?
A multilingual report is not a one-off exercise in translating every field word for word. Some case studies may be relevant only in selected markets, while indicators remain common and explanations are localised. Track the content owner, translation status, approver and publication date for each language. Plan URL structures, language switching, metadata and alternate-language annotations from the beginning.
The content management system is not simply a screen for editing copy; it is a data-governance layer for the report. Depending on scope, it may need user roles, draft and approval workflows, version history, scheduled publishing, media management and audit logs. Localised pages must remain connected without forcing teams to publish incomplete translations. Editorial dashboards can highlight stale content, missing fields and differences between approved datasets and public pages.
If indicators come from several systems, define the integration direction, refresh frequency, failure behaviour and data owner. Automation is not mandatory in every project. Controlled imports followed by editorial approval may be safer for organisations with formal assurance processes. Kumsal Agency’s custom web development approach scopes roles, data, integrations and management tools around the organisation’s real workflows.
How can data security and trust be protected?
Even when the published report is public, the CMS, draft figures, user accounts and integration credentials require protection. Least-privilege access, strong authentication, logging, secure development practices, regular updates and tested restoration procedures should form part of the operating plan. If forms or personalisation are used, define why data is collected, how long it is retained and who may access it.
Trust is broader than cybersecurity. Each indicator should clearly state its period, unit, boundary, methodology and, where relevant, assurance status. Corrections made after publication should be handled through versions and update notes rather than silent replacement. The interface must support an auditable account of performance, not obscure uncertainty behind polished visuals.
How should success be measured with analytics?
Page views alone do not demonstrate that a report has been understood. More meaningful events include moving from a topic page to an indicator detail, using a filter, downloading data or the PDF, opening methodology information, switching language and following links intended for external stakeholders. For each event, the analytics plan should document the business question, trigger condition, consent implications and reporting owner.
Qualitative evidence is equally important. Short task-based sessions with investors, employees or sustainability specialists can reveal whether people find the correct figure and whether charts are misinterpreted. After launch, review on-site searches, zero-result queries and abandoned journeys. These findings can drive changes to terminology, navigation and content relationships instead of merely producing a traffic dashboard.
Create a sustainable digital reporting experience with Kumsal Agency
An effective sustainability-report website brings content strategy, user experience, visual storytelling, software architecture and operational ownership into one system. Kumsal Agency combines Art Director-led, brand-specific interfaces with information architecture, data-led visualisation, advanced animation and manageable software infrastructure. Its web design process begins with audiences and user tasks, then addresses responsive behaviour, accessibility and performance as connected requirements.
The result should not be a visual copy of a static document. It should help stakeholders reach dependable evidence quickly while giving the organisation a practical way to maintain languages, reporting periods, approvals and integrations. To assess your sustainability report through its audiences, content structure, interactions, languages, integrations and management requirements, contact Kumsal Agency.