


Aydınlatma metni yükleniyor…
If your website attracts visitors but few quotation enquiries, the first step is not necessarily to buy more traffic or redesign everything. Examine audience relevance, page messaging, form delivery and sales follow-up as separate stages. The same apparent outcome—no leads—can result from very different problems.
This guide helps B2B service, software and manufacturing businesses assess an existing website. It is not another homepage template. Its purpose is to identify what needs attention first. The diagnostic matrix and numerical example were developed for this article; they are neither Kumsal Agency client results nor industry benchmarks.
Define what you mean by a quotation enquiry
A button click, an attempted form submission, a record accepted by the server and a request qualified by sales are different events. If a report measures one while the team discusses another, you may be trying to solve the wrong problem.
Here, a usable enquiry means a non-spam, non-duplicate record with a valid way to respond and a requirement related to the company's services. Sales qualification is a further assessment: scope, timing or the buying process may still be unclear. This distinction helps identify changes that increase form volume but mainly add work for the sales team.
Enquiries may also arrive by phone, email or messaging. Looking only at forms without considering those channels produces an incomplete picture. However, a phone-link click is not a confirmed conversation, and a conversation is not a won customer. State which stage can genuinely be verified for each channel.
Start with a five-stage diagnostic matrix
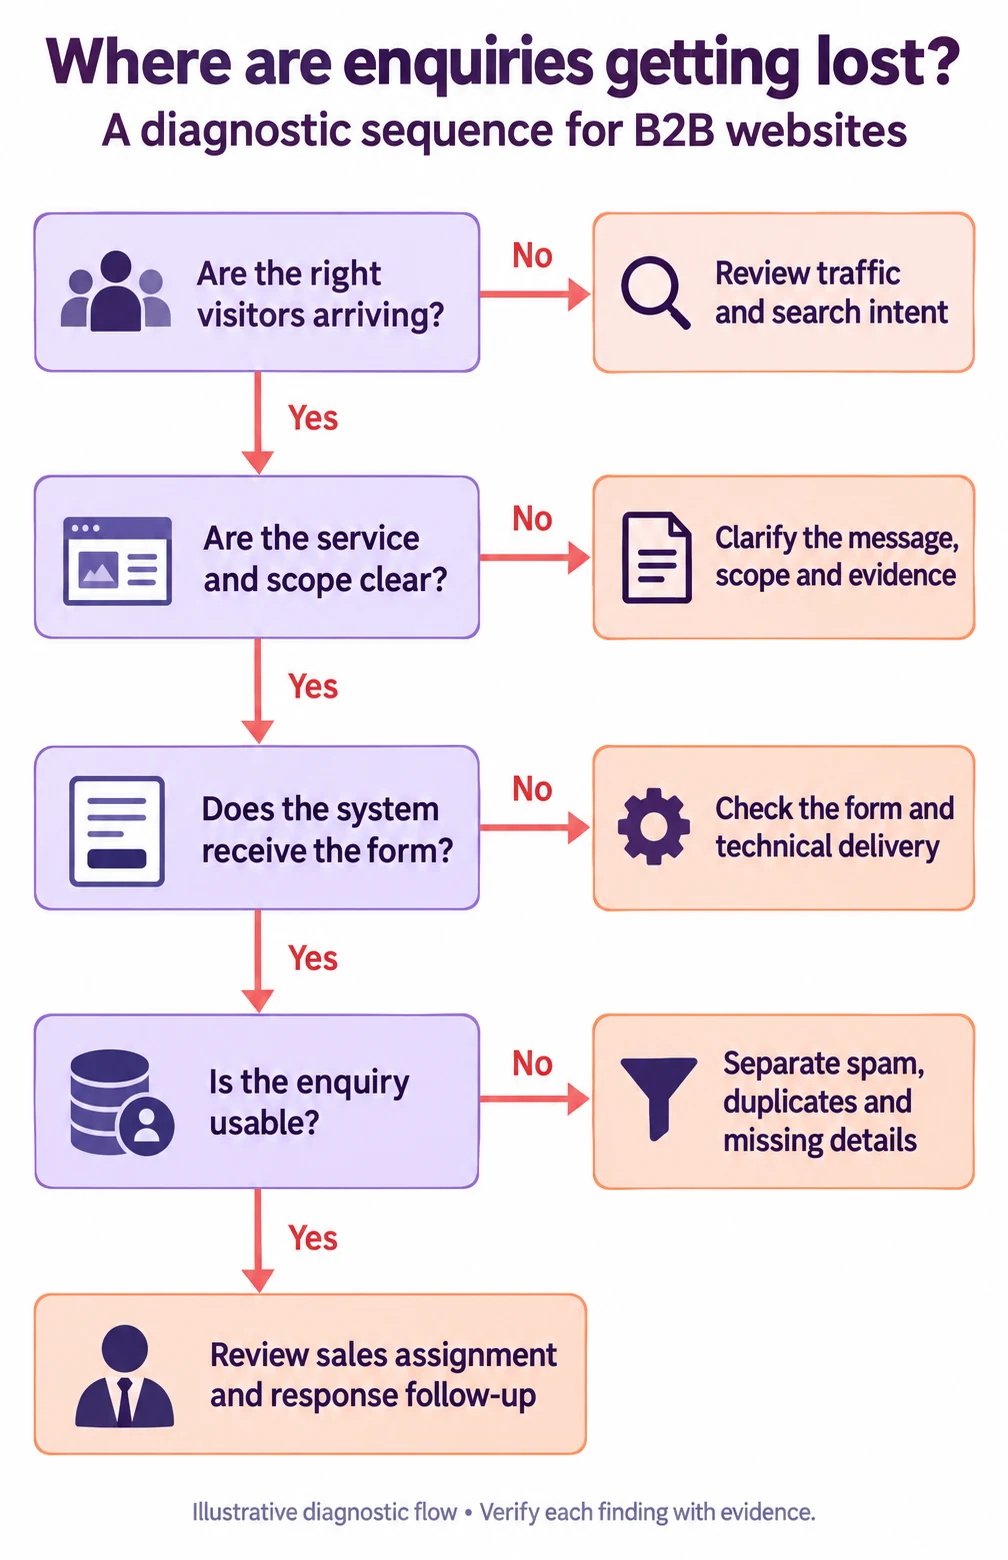
Apply the following table separately to several important service or product pages. A site-wide average can conceal a problem affecting one language or device. Record each suspicion as an explanation to test, not as a confirmed diagnosis.
| Stage | Symptom | Evidence to examine | First action |
|---|---|---|---|
| Traffic relevance | Visits without much service investigation | Landing page, campaign objective, language and search queries | Separate mismatched intent |
| Message and scope | Interest without a clear next step | Headline, service scope and observed user behaviour | Explain who the service is for and what it includes |
| Trust and decision information | Buying questions remain unanswered | Verified work, process and deliverables | Add missing decision information |
| Form and technical delivery | Starts but few accepted records | Validation errors, server records and mobile tests | Fix the functional failure |
| Sales follow-up | Records without relevant conversations | Assignment, responses and loss reasons | Clarify ownership and follow-up |
The point is not to find a change for every stage. If records arrive correctly but nobody owns them in sales, changing the form colour is not the first intervention. If many visitors are looking for employment, the service-enquiry rate alone cannot explain the quality of the design.
1. Are these visitors plausible buyers?
Segment traffic by meaningful dimensions such as landing page, channel, language and device. Someone learning a technical concept and someone choosing a supplier should not be expected to request a proposal at the same point. An educational article can still be valuable, but it needs an appropriate next step for its reader.
Search terms containing signals such as free resources, vacancies or learning can help reveal intent. Those visits are not automatically worthless; they may simply have a different relationship to the current commercial objective. Consider the query, page content and offered service together rather than deciding from one word.
If an advertisement creates a different service or price expectation, even a well-designed page will retain that mismatch. Read the campaign promise, landing page and proposal scope side by side. Examine visitors seeking the right service separately instead of trying to force every visit into an enquiry.
2. Does the page explain the offer and the next action?
A line about building a digital future may express brand tone, but it does not define a service. Explain the problem addressed, the deliverables, the project stages included and what someone should share before an initial discussion.
For example, a field service app page can explain that work orders, inventory integration and offline recording requirements will be assessed, rather than only listing technologies. This is an editorial recommendation about scope clarity, not a promise of improved conversion.
The call to action and the following screen should describe the same task. “Discuss your project” can lead to a concise scope form. Do not promise a free report, instant pricing or a fixed response time unless those services actually exist. Reduce uncertainty about the first step without misrepresenting the eventual engagement.
3. Is the evidence needed for a decision available?
Trust is not limited to customer logos. A buyer may need to understand deliverables, responsibilities, the contribution expected from their team and post-launch support. Explaining these clearly is useful even for businesses without an extensive public case-study library.
When showing a project, identify your actual contribution. Do not manufacture outcome percentages when verified client data is unavailable. An illustrative example is acceptable when its hypothetical nature is clear. Anonymised questions repeatedly received by sales can provide a stronger content starting point than unsupported success claims.
A page may be inadequate because important questions remain unanswered, not because it is short. A long page that never defines the scope is no better. For each proposed section, identify the buyer question it answers and remove additions that merely inflate the word count.
4. Can visitors complete the form and deliver the record?
Test desktop and mobile versions, both languages and invalid-input scenarios. Check what happens after an invalid email, a missing required field, an unsupported attachment or a connection interruption. Finish the test by verifying the accepted record, not simply by clicking submit.
The W3C input validation tutorial addresses identifying errors and helping people correct them. Instead of clearing the form after a generic failure message, identify the relevant field and explain the correction. Do not communicate an error through colour alone.
Before removing a field, ask sales how it is used. Unnecessary inputs can go; removing information needed for an initial assessment may create more incomplete enquiries. Evaluate single-page and multi-step designs against actual user tasks rather than imposing one pattern on every form.
For the detailed delivery checks, use our end-to-end website form monitoring guide. The purpose here is to distinguish a form problem from other causes of lost enquiries.
5. Do analytics and sales records describe the same reality?
Our suggested measurement sequence is relevant page visit, form start, server-accepted submission, usable enquiry and sales-reviewed request. Keep each definition alongside the report. Browser analytics and server records may differ because of consent choices or technical conditions; the difference is not automatically a count of lost buyers.
Google Analytics recommended events include generate_lead for lead generation. Define the actual business state that triggers it in your implementation. Recording success on every button click can make failed or repeated attempts look like outcomes.
Do not put names, email addresses, telephone numbers or free-text form responses into analytics events. Google's rules on personally identifiable information prohibit sending that information to Analytics. Use event types, page context and appropriately designed technical status information rather than contact content.
A worked example: three different readings of one dataset
The following numbers are entirely hypothetical. Suppose a service page receives 1,000 sessions, 40 form starts and 20 accepted submissions during the same reporting period and scope. Eight submissions are classified as usable enquiries.
- Accepted submissions divided by form starts: 20 / 40=50%.
- Accepted submissions per session: 20 / 1,000=2%.
- Usable enquiries divided by accepted submissions: 8 / 20=40%.
These calculations are not interchangeable. The first helps assess the form flow, the second relates submission volume to traffic, and the third describes record quality. Because one person may have several sessions or submissions, do not present the session-based ratio as a unique-person conversion rate. Keep numerator and denominator definitions fixed.
What should a low-volume B2B website change first?
A few additional enquiries can move percentages substantially when volumes are small. Do not infer a definite causal effect from a short before-and-after comparison. Campaigns, prices or service scope may have changed at the same time. If an A/B test is appropriate, define the primary measure, sample requirements and decision method before starting; elapsed days alone are not sufficient.
First fix verified functional failures such as broken submission or incorrect language links. Then select an observation-led hypothesis: for example, users ask basic scope questions before completing the form because the service boundaries are unclear. Improve that explanation and examine enquiry quality and the questions received. Making many independent changes together makes learning harder.
A working sheet containing the issue, evidence, proposed change, owner and evaluation measure is enough to begin. To assess your website with Kumsal Agency, share the relevant pages, your current traffic summary and enquiry examples stripped of personal information. We can then identify whether content, user experience, technical delivery or sales follow-up deserves attention first.